Chart of the week: China’s smog index heralds weakness
Smog levels in five major Chinese cities climbed along with house prices in early 2017 and late 2018. Now, it's pointing down.

You are now subscribed
Your newsletter sign-up was successful
Want to add more newsletters?

Twice daily
MoneyWeek
Get the latest financial news, insights and expert analysis from our award-winning MoneyWeek team, to help you understand what really matters when it comes to your finances.

Four times a week
Look After My Bills
Sign up to our free money-saving newsletter, filled with the latest news and expert advice to help you find the best tips and deals for managing your bills. Start saving today!

Trying to gauge the state of the Chinese economy is often like peering through smog; official statistics are widely deemed unreliable. But smog itself, or rather the absence of it, backs up other recent signs that growth has come off the boil, as Nathaniel Taplin points out in The Wall Street Journal.
Air pollution correlates best with the "housing-driven heavy industry sector". Pollution levels in five major cities climbed along with the "last two big run-ups" in house prices in early 2017 and late 2018.
Pollution levels are "now trending sharply lower again". The PMI survey tracking construction is down sharply year-on-year, and overall house price growth has eased to an annual pace of 8%, compared with 11% in mid-2019.
MoneyWeek
Subscribe to MoneyWeek today and get your first six magazine issues absolutely FREE

Sign up to Money Morning
Don't miss the latest investment and personal finances news, market analysis, plus money-saving tips with our free twice-daily newsletter
Don't miss the latest investment and personal finances news, market analysis, plus money-saving tips with our free twice-daily newsletter
Viewpoint
John Mauldin, Mauldin Economics

-
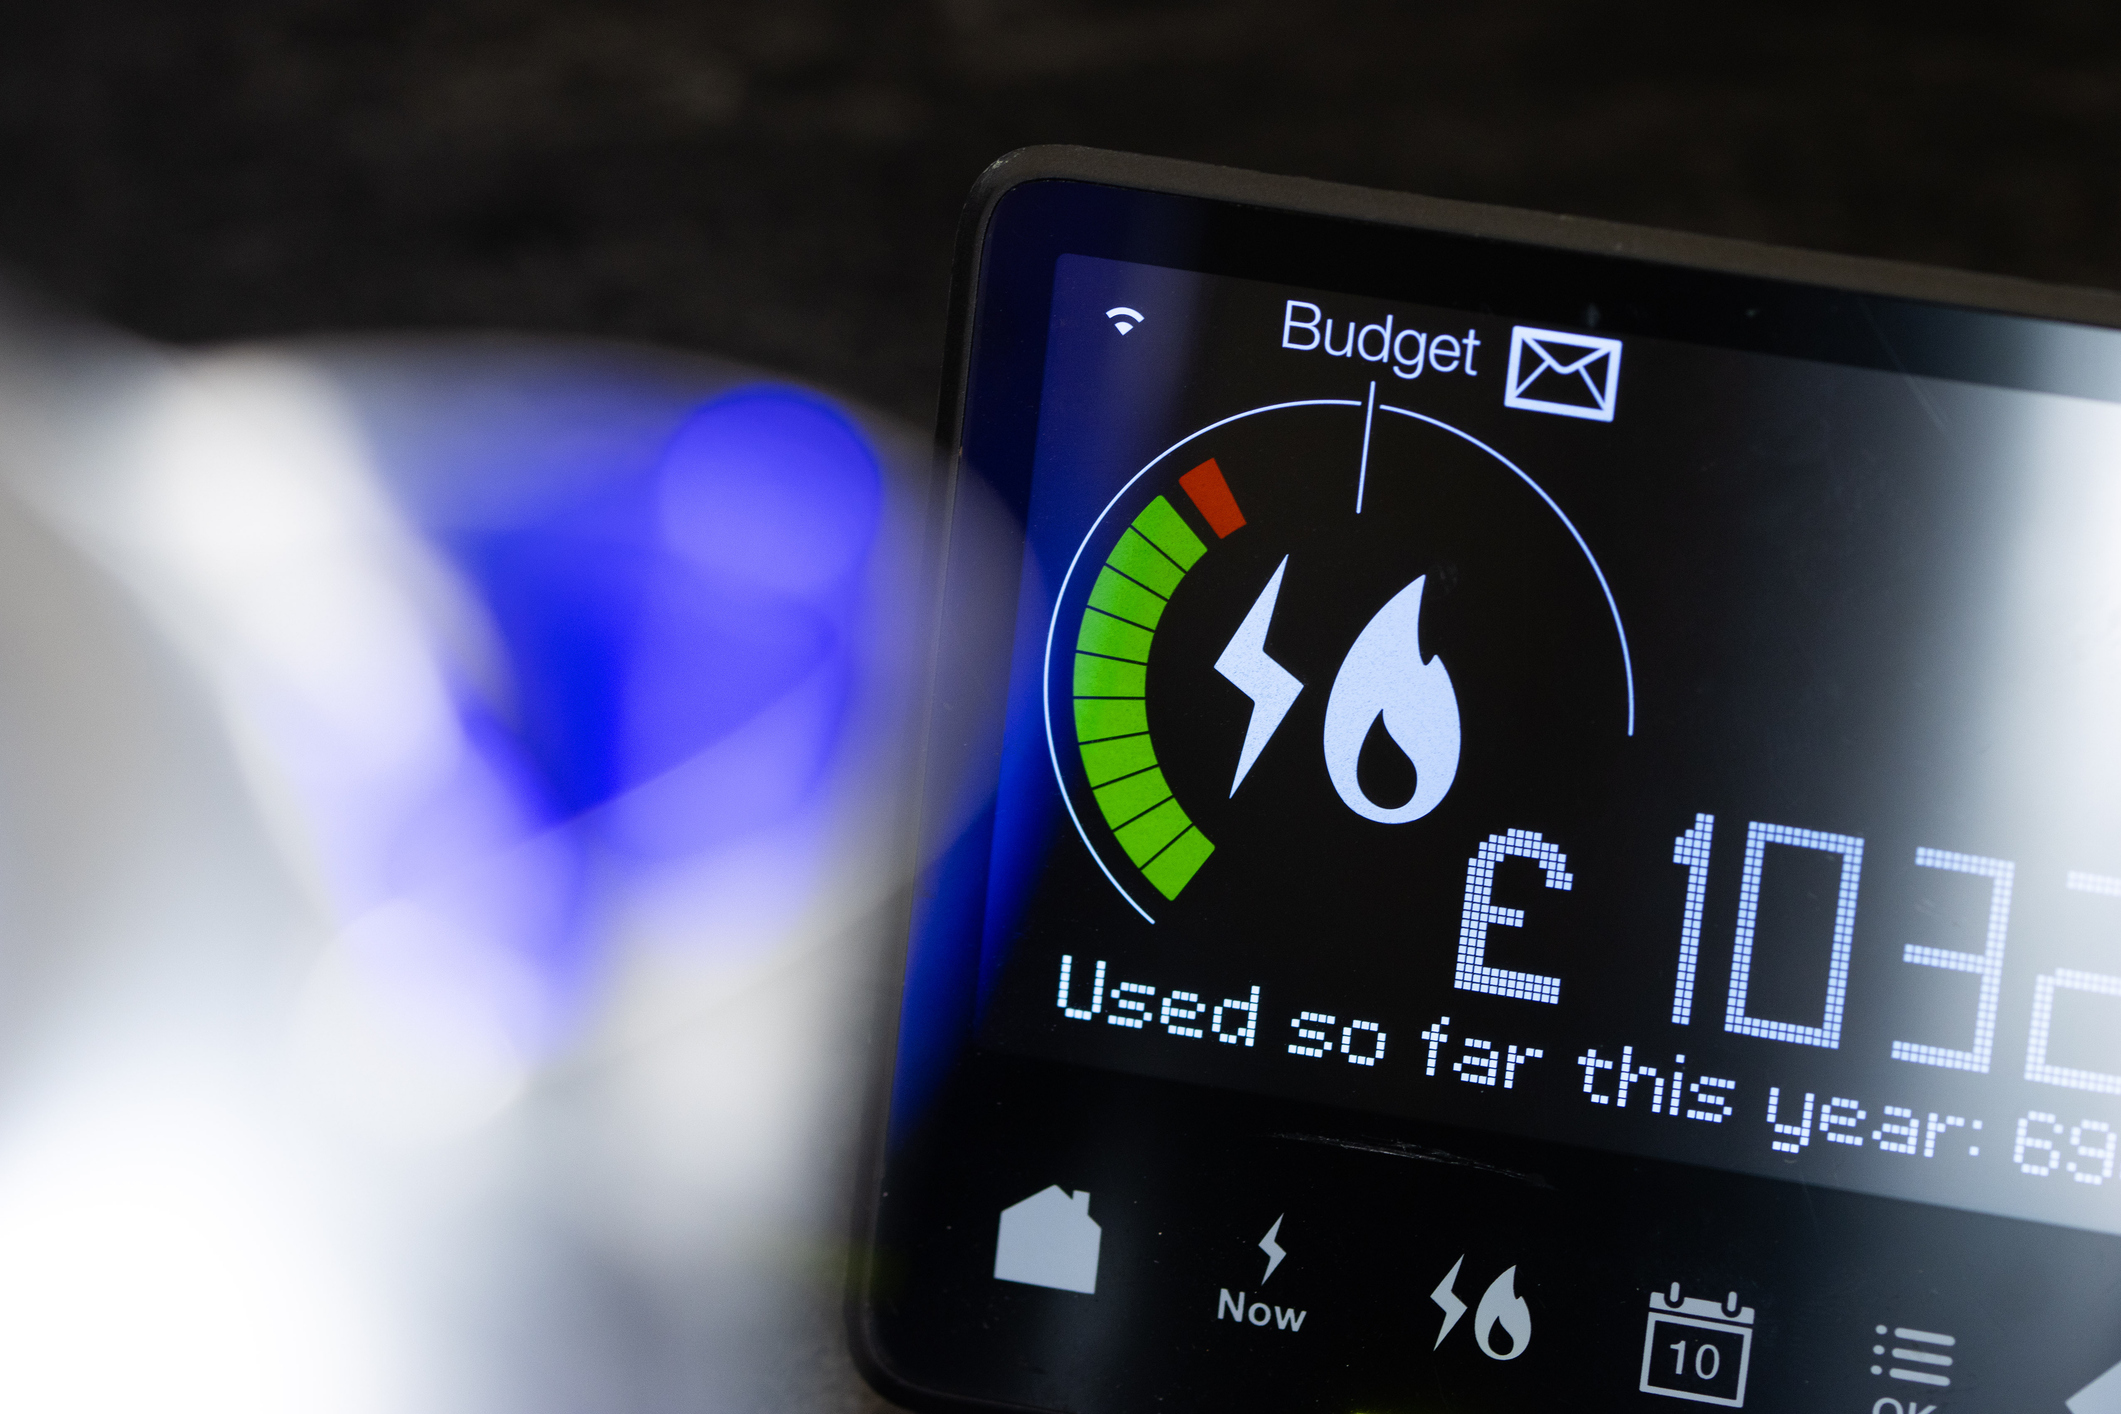 MoneyWeek news quiz: Can you get smart meter compensation?
Smart meter compensation rules, Premium Bonds winners, and the Bank of England’s latest base rate decision all made the news this week. How closely were you following it?
-
 Adventures in Saudi Arabia
Travel The kingdom of Saudi Arabia in the Middle East is rich in undiscovered natural beauty. Get there before everybody else does, says Merryn Somerset Webb


-
 The charts that matter: bond yields and US dollar continue to climb
Charts The US dollar and government bond yields around the world continued to climb. Here’s what happened to the charts that matter most to the global economy.
-
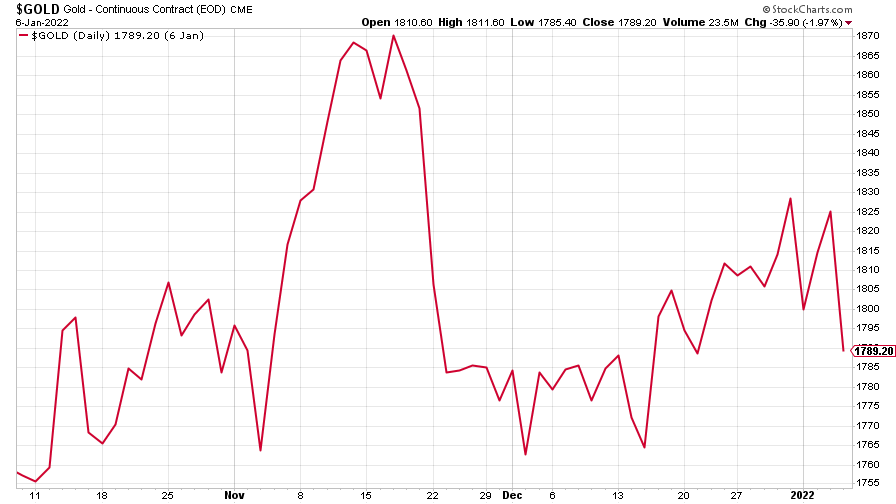 The charts that matter: markets start the year with a crash
Charts As markets start 2022 with a big selloff, here’s what happened to the charts that matter most to the global economy.
-
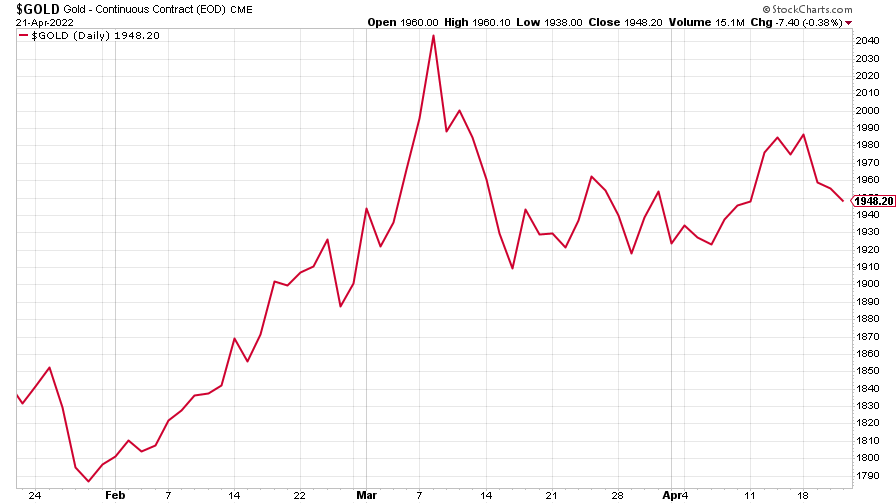
 The charts that matter: Fed becomes more hawkish
Charts Gold rose meanwhile the US dollar fell after a key Fed meeting. Here’s what else happened to the charts that matter most to the global economy.
-
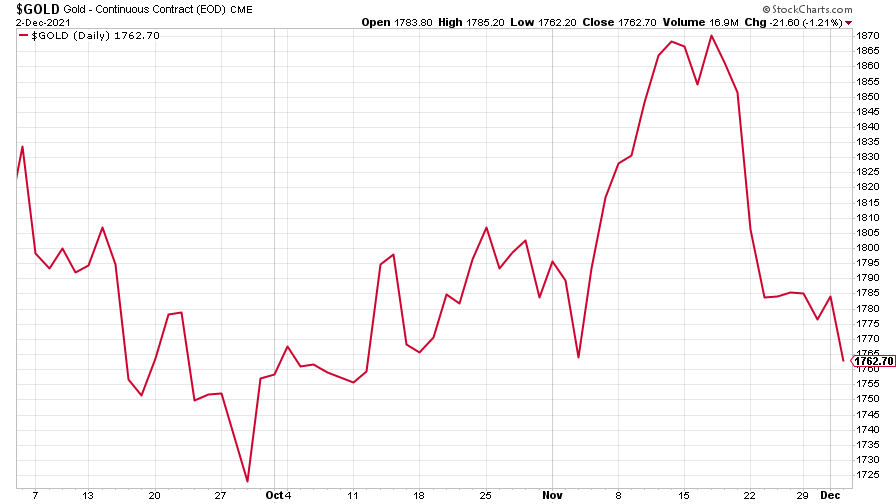
 The charts that matter: a tough week for bitcoin
Charts Cryptocurrency bitcoin slid by some 20% this week. Here’s what else happened to the charts that matter most to the global economy.
-
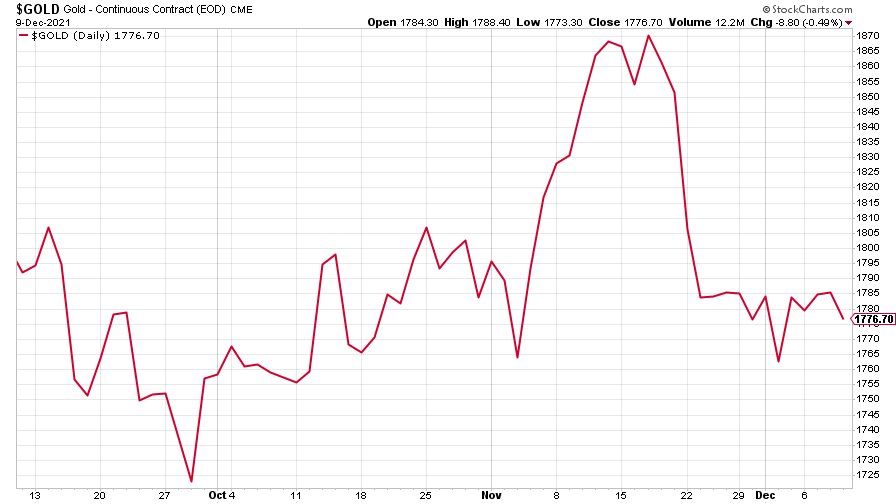
 The charts that matter: omicron rattles markets
Charts Markets were rattled by the emergence of a new strain of Covid-19. Here’s how it has affected the charts that matter most to the global economy.
-
 The charts that matter: the US dollar keeps on strengthening
Charts The US dollar saw further rises this week as gold and cryptocurrencies sold off. Here’s how that has affected the charts that matter most to the global economy.
-
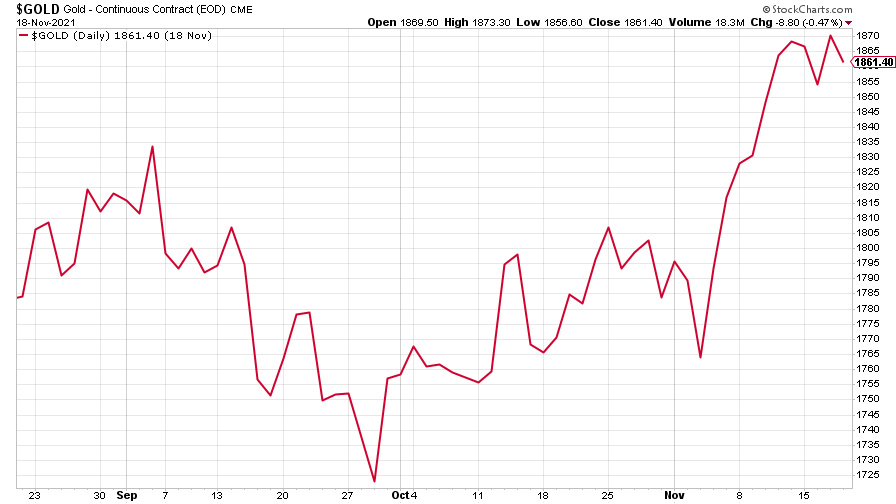 The charts that matter: gold hangs on to gains while the dollar continues higher
Charts The gold price continued to hang on to last week’s gains, even as the US dollar powered higher this week. Here’s how that has affected the charts that matter most to the global economy.
-
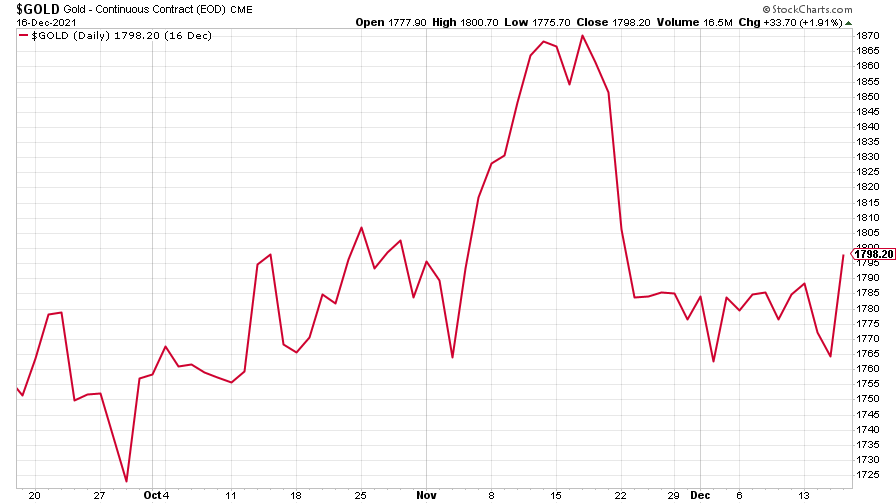
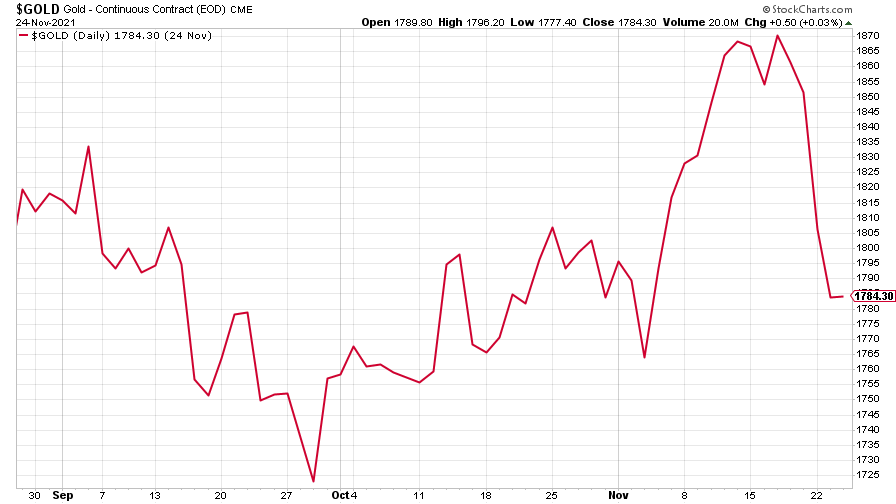
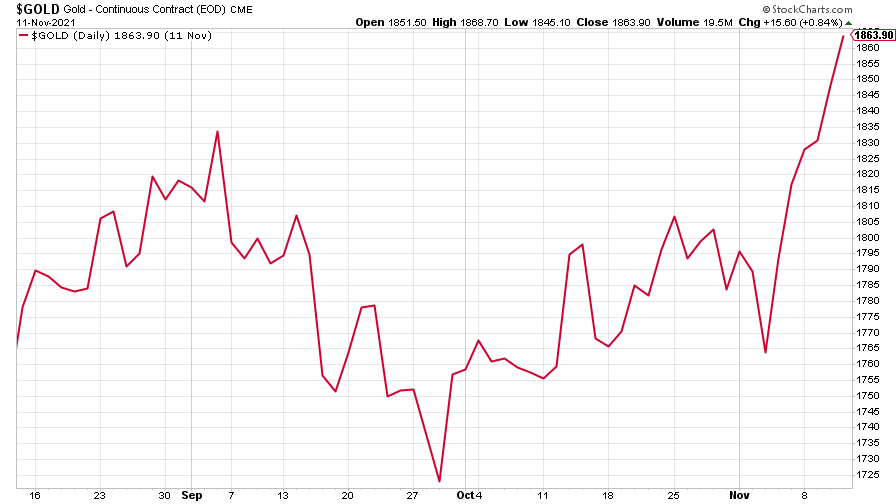 The charts that matter: inflation fears give gold a much needed boost
Charts US inflation hit its highest in 30 years this week, driving gold and bitcoin to new highs. Here’s how that has affected the charts that matter most to the global economy.


