
It’s Monday morning, which means it’s time for the next in our series looking at simple technical analysis.
Today we consider perhaps the most recognisable chart pattern of the lot – the “double top”, and its twin sibling, the “double bottom”. And, specifically, we look at what these patterns might suggest for the pound.
What are double tops and bottoms?
Double tops and bottoms are straightforward to understand. A price reaches a certain level, pulls back, then re-tests that level, ideally on lighter volume. The retest fails, signalling a change in trend, and off goes the price in the other direction.
Try 6 free issues of MoneyWeek today
Get unparalleled financial insight, analysis and expert opinion you can profit from.

Sign up to Money Morning
Don't miss the latest investment and personal finances news, market analysis, plus money-saving tips with our free twice-daily newsletter
Don't miss the latest investment and personal finances news, market analysis, plus money-saving tips with our free twice-daily newsletter
A double top can be extremely bearish, while a double bottom can be extremely bullish. You will often see double tops and bottoms both at major market highs and lows.
They can be identified on monthly, weekly or daily time frames – even intraday. But the longer the time frame, the more powerful the formation. However, take note, you can see them starting to take shape all the time, but often the formation does not complete.
When a price is rising, then pulls back, then rises again – as always happens in a bull market – you will see what looks like a double top starting to form as the price retests its old high. But more often than not, the price will continue upwards and so the double top pattern never completes.
Don’t try and second-guess double tops and bottoms until they are fully formed. Otherwise, without risk management in place, you will end up losing a lot of money.
We are going to look at one of the most memorable double tops of my lifetime, one that played out over many years in the S&P 500, arguably the most important stockmarket in the world, between 1994 and 2014.
The best double tops occur at the end of an extended move up. We certainly got that in the 1990s. In 1990, the S&P 500 was trading below 300. In March 2000, at the peak of dotcom mania, the S&P hit 1,540. Over the following months the market pulled back, then rallied. The rally got as high as 1,525 – 15 points off the March high. Then the dotcom bubble well and truly burst, and the S&P went into freefall. So we got something of a double top that year, albeit not a perfect one.
In July 2002, the S&P made something of a low at 796. It rallied a little, but by October had sunk beneath that low, touching 776. It rallied again. In March 2003, it hit that low of 796 again. But the low held.
The subsequent rally took the S&P above the level of the previous two rallies – the neckline – and so did the S&P go off an epic four-year bull market that took it, by 2007, all the way back to 2000 highs. In July 2007 it hit 1,554 – marginally exceeding its 2000 levels. Then it pulled back. Then in October, it got just above 1,569 before it ran out of steam. So not only did we get double tops within the years 2000 and 2007, we got a double top that formed over many years.

Once the patterns were complete, and the necklines breached, we got major changes in direction. You can see the intra-year double tops in blue; the “necklines” in green dashed lines; and the multi-year top in red.
All very easy to identify in the rear view mirror, of course.
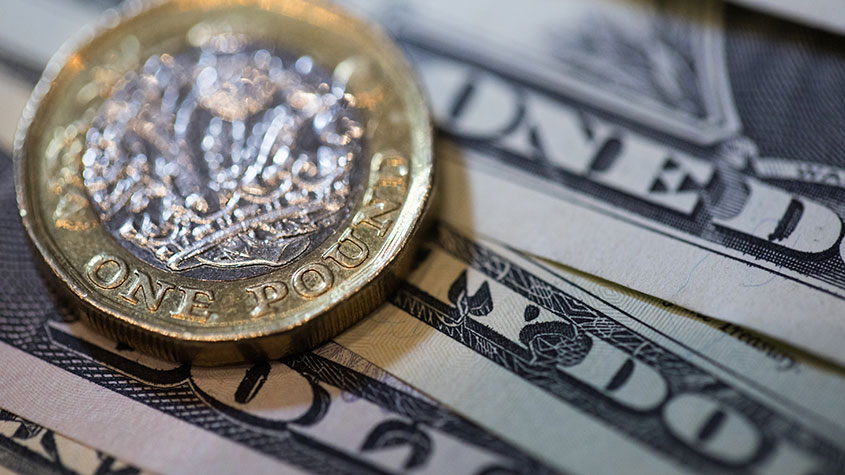
Is there a double top forming in the US dollar? And what does it mean for sterling?
But if we fast-forward to today and take a look at the US dollar, as we discussed last Wednesday, you will see something of a double top in place. Or you might even consider – lord help us – cable (the pound vs the dollar).

You can’t see it on this chart (because it happened overnight) but during the Flash Crash of October 2016, the pound hit $1.14 ($1.12 according to some measures – reports are not consistent). That’s the same level it hit in March of this year during peak corona panic.
Has the pound made a multi-year low against the US dollar? Are we in a new bull market for the pound? It’s hard to believe, given the fundamentals, but the technicals are there. Sterling back to $1.60 anyone?

-
 Number of 45% taxpayers more than doubles in five years. What should you do if you’re in a higher band?
Frozen thresholds mean that more taxpayers are dragged into higher tax brackets despite little change in their purchasing power.
-
 How could El Niño and climate change impact your investments?
This year’s El Niño looks set to be a particularly strong one. The weather system has previously seen agricultural commodity prices soar.


-
 What's behind the big shift in Japanese government bonds?
Rising long-term Japanese government bond yields point to growing nervousness about the future – and not just inflation
-
 Why you should keep an eye on the US dollar, the most important price in the world
Advice The US dollar is the most important asset in the world, dictating the prices of vital commodities. Where it goes next will determine the outlook for the global economy says Dominic Frisby.
-
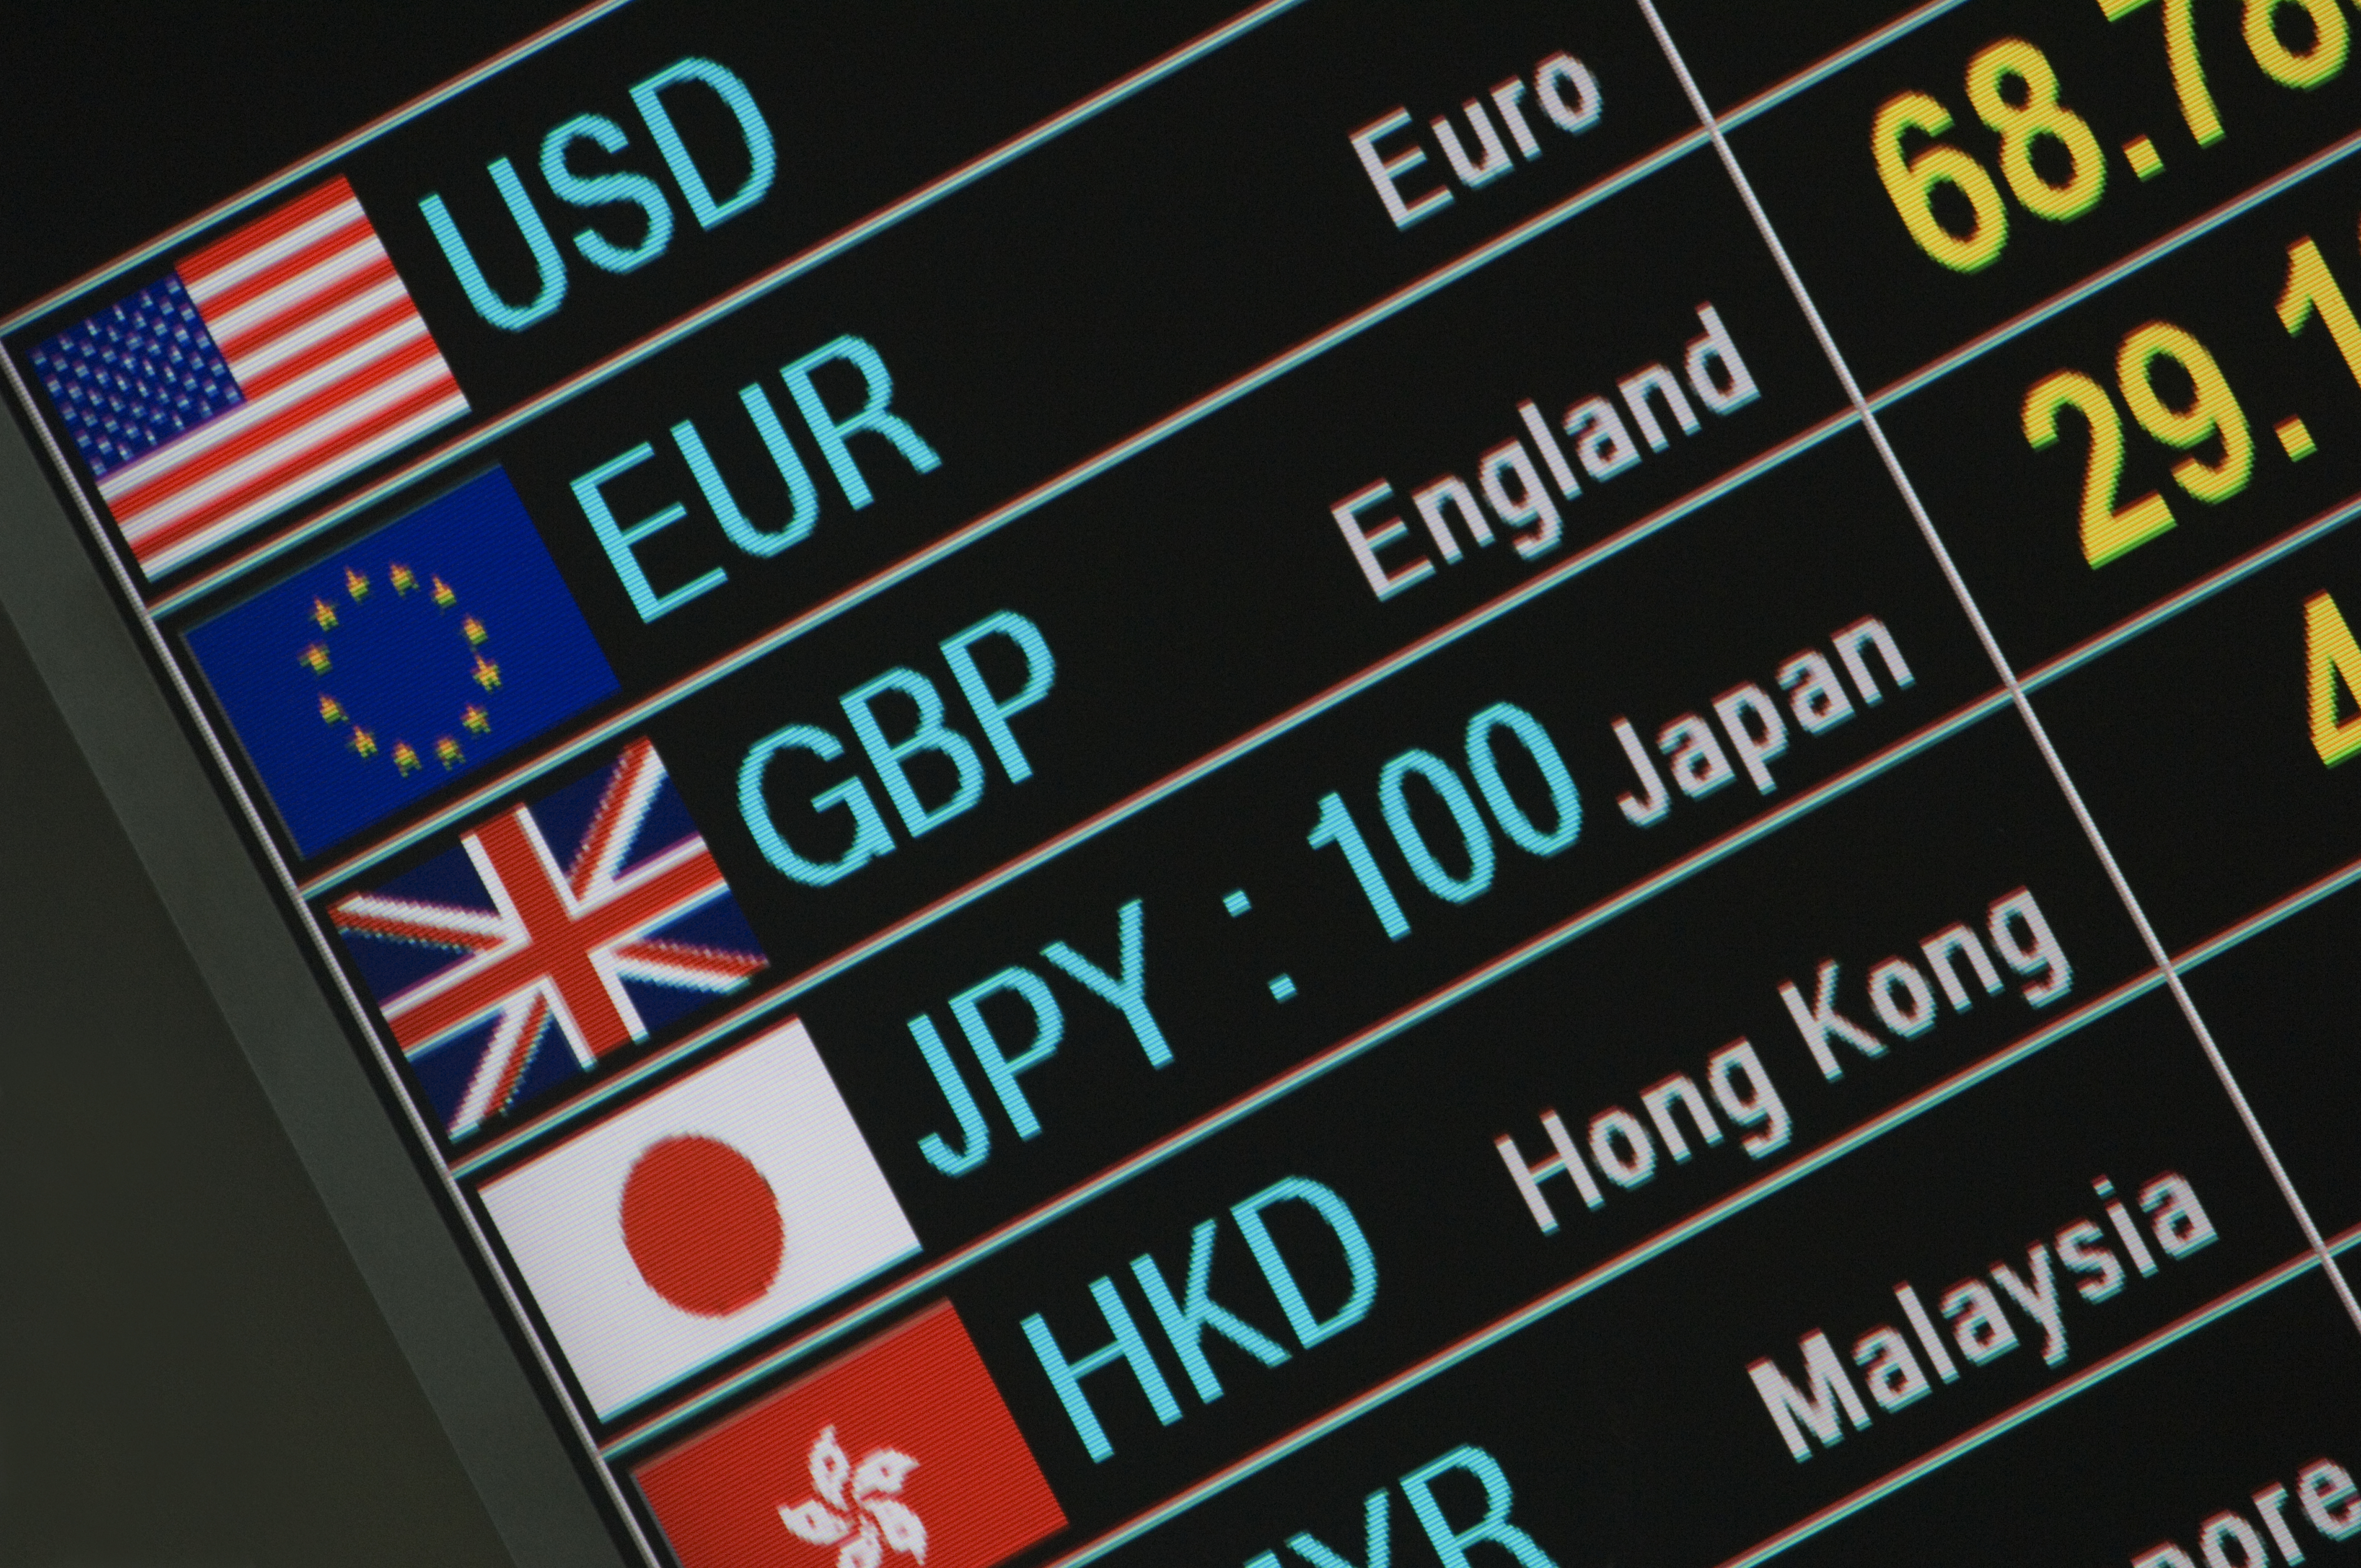 What is FX trading?
What is FX trading and can you make money from it? We explain how foreign exchange trading works and the risks
-
 The Burberry share price looks like a good bet
Tips The Burberry share price could be on the verge of a major upswing as the firm’s profits return to growth.
-
 Sterling accelerates its recovery after chancellor’s U-turn on taxes
News The pound has recovered after Kwasi Kwarteng U-turned on abolishing the top rate of income tax. Saloni Sardana explains what's going on..
-
 Why you should short this satellite broadband company
Tips With an ill-considered business plan, satellite broadband company AST SpaceMobile is doomed to failure, says Matthew Partridge. Here's how to short the stock.
-
 It’s time to sell this stock
Tips Digital Realty’s data-storage business model is moribund, consumed by the rise of cloud computing. Here's how you could short the shares, says Matthew Partridge.
-
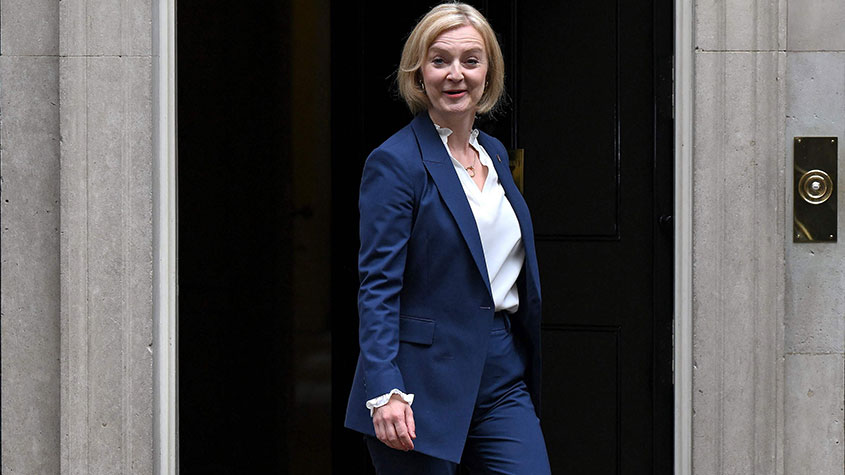 Will Liz Truss as PM mark a turning point for the pound?
Analysis The pound is at its lowest since 1985. But a new government often markets a turning point, says Dominic Frisby. Here, he looks at where sterling might go from here.


