
It’s Monday morning, which means it’s time for the next in our series looking at simple technical analysis techniques.
Today, it’s Fibonacci retracements and extensions...
How the work of an Italian mathematician resonates with technical analysts today
Fibonacci, aka Leonardo di Pisa, was an Italian mathematician who lived from 1170 to 1240. He was considered the greatest mathematician of the Middle Ages.
Try 6 free issues of MoneyWeek today
Get unparalleled financial insight, analysis and expert opinion you can profit from.

Sign up to Money Morning
Don't miss the latest investment and personal finances news, market analysis, plus money-saving tips with our free twice-daily newsletter
Don't miss the latest investment and personal finances news, market analysis, plus money-saving tips with our free twice-daily newsletter
He acquired the name Fibonacci, because his surname was Bonacci and he was “filius” – the son of – Bonacci.
He is most famous for his work on a curious sequence of numbers, the Fibonacci sequence. His sequence is strongly linked to Phi – the “Golden Ratio” studied so ardently by the ancient Greeks, whose proportions are closely followed by artists, especially architects.
Each number in the sequence is the sum of the previous two, so the sequence goes like this: 1, 1, 2, 3, 5, 8, 13, 21, 34, 55, 89, 144, 233 and so on.
He arrived at the sequence while observing the reproduction rate of rabbits. “How many pairs of rabbits placed in an enclosed area can be produced in a single year from one pair of rabbits,” he asked, “if each pair gives birth to a new pair each month starting at the second month?”
The same sequence can often be observed in nature in the way that, for example, trees branch, bees reproduce, flower petals unfurl – even in the way pine cones arrange.
That’s all very well, you might think – but how does it apply to investors?
Well, the same sequence can also be observed in markets, so the theory goes, and the price points that they reach as they trade.
This might sound like numerological gobbledeegook – even by the standards of a field that is already often viewed from the outside with scepticism.
But there are many who have made a lot of money who swear by Fibonacci. At the same time they will be mocked by many in the media – especially fundamental analysts.
So how does it work?
How Fibonacci can be applied to markets
Fibonacci retracement levels are the points at which support and resistance are likely to occur. They are percentage levels based on Fibonacci numbers.
In the sequence, the ratio of any number to the next one higher is approximately .618 to 1 and to the next lower number approximately 1.618 to 1. (This is also the golden ratio). Between alternate numbers in the sequence, the ratio is approximately .382.
Thus the levels that are most commonly used are 38.2% and 61.8%. And while it is not a Fibonacci ratio, 50% is also often used.
So let’s say a market is trading at 200 and it falls to 100. Where is it going to go on the rebound? The Fibonacci retracement levels – the targets – would therefore be 138.2, 150 and 161.8.
Here we see the FTSE 100 over the past year. Using the Fibonacci tool, I’ve marked the range from the January high to the March low (blue lines), which occurred as the world woke up to the spread of Covid-19 and the resulting lockdown.
The retracement levels are the dashed lines. What’s interesting is that – looking at the grey oval areas – you can clearly see how the rebounds in the FTSE 100 since the low have each petered out close to a Fibonacci level.

What would Fibonacci suggest about gold target prices from here?
As well as retracements, the same principles apply to extensions.
Let’s have some fun with a long-term chart of gold, as it has just broken out to all-time highs this morning. The previous high from September 2011 was $1,920/oz or thereabouts. The low was $1,050/oz (see grey ovals)
This morning it has broken out to $1,940/oz as I write. Where’s it going to next?
The blue dashed lines give us some potential targets.

A 1.382 extension of the move gives us a target around $2,258. 1.5 take us to the $2,360 area. 1.618 has us looking above $2,460.
I think those kinds of levels are entirely possible within a year or three given the circumstances. Fingers crossed.
Perhaps we will even get the full 100% – that takes to the $2,800/oz level. Which would be nice.
So there we are – Fibonacci retracements and extensions. Gobbledeegook – or golden?

-
 Number of over-65s paying tax surpasses 10 million for the first time
Why thousands more pensioners face higher tax bills as pension income rises. Could you be one of them?
-
 Can Andy Burnham save the UK’s stock market?
Undervalued UK firms are being bought out by overseas institutions, and a lack of IPO activity means London's market is shrinking


-
 What's behind the big shift in Japanese government bonds?
Rising long-term Japanese government bond yields point to growing nervousness about the future – and not just inflation
-
 Is the stock market open on Spring bank holiday?
As the Spring bank holiday draws near, we look at whether the UK and US stock markets will remain open as usual or if there’s a change to trading hours.
-
 Halifax: House price slump continues as prices slide for the sixth consecutive month
UK house prices fell again in September as buyers returned, but the slowdown was not as fast as anticipated, latest Halifax data shows. Where are house prices falling the most?
-
 Rents hit a record high - but is the opportunity for buy-to-let investors still strong?
UK rent prices have hit a record high with the average hitting over £1,200 a month says Rightmove. Are there still opportunities in buy-to-let?
-
 Pension savers turn to gold investments
Investors are racing to buy gold to protect their pensions from a stock market correction and high inflation, experts say
-
 Where to find the best returns from student accommodation
Student accommodation can be a lucrative investment if you know where to look.
-
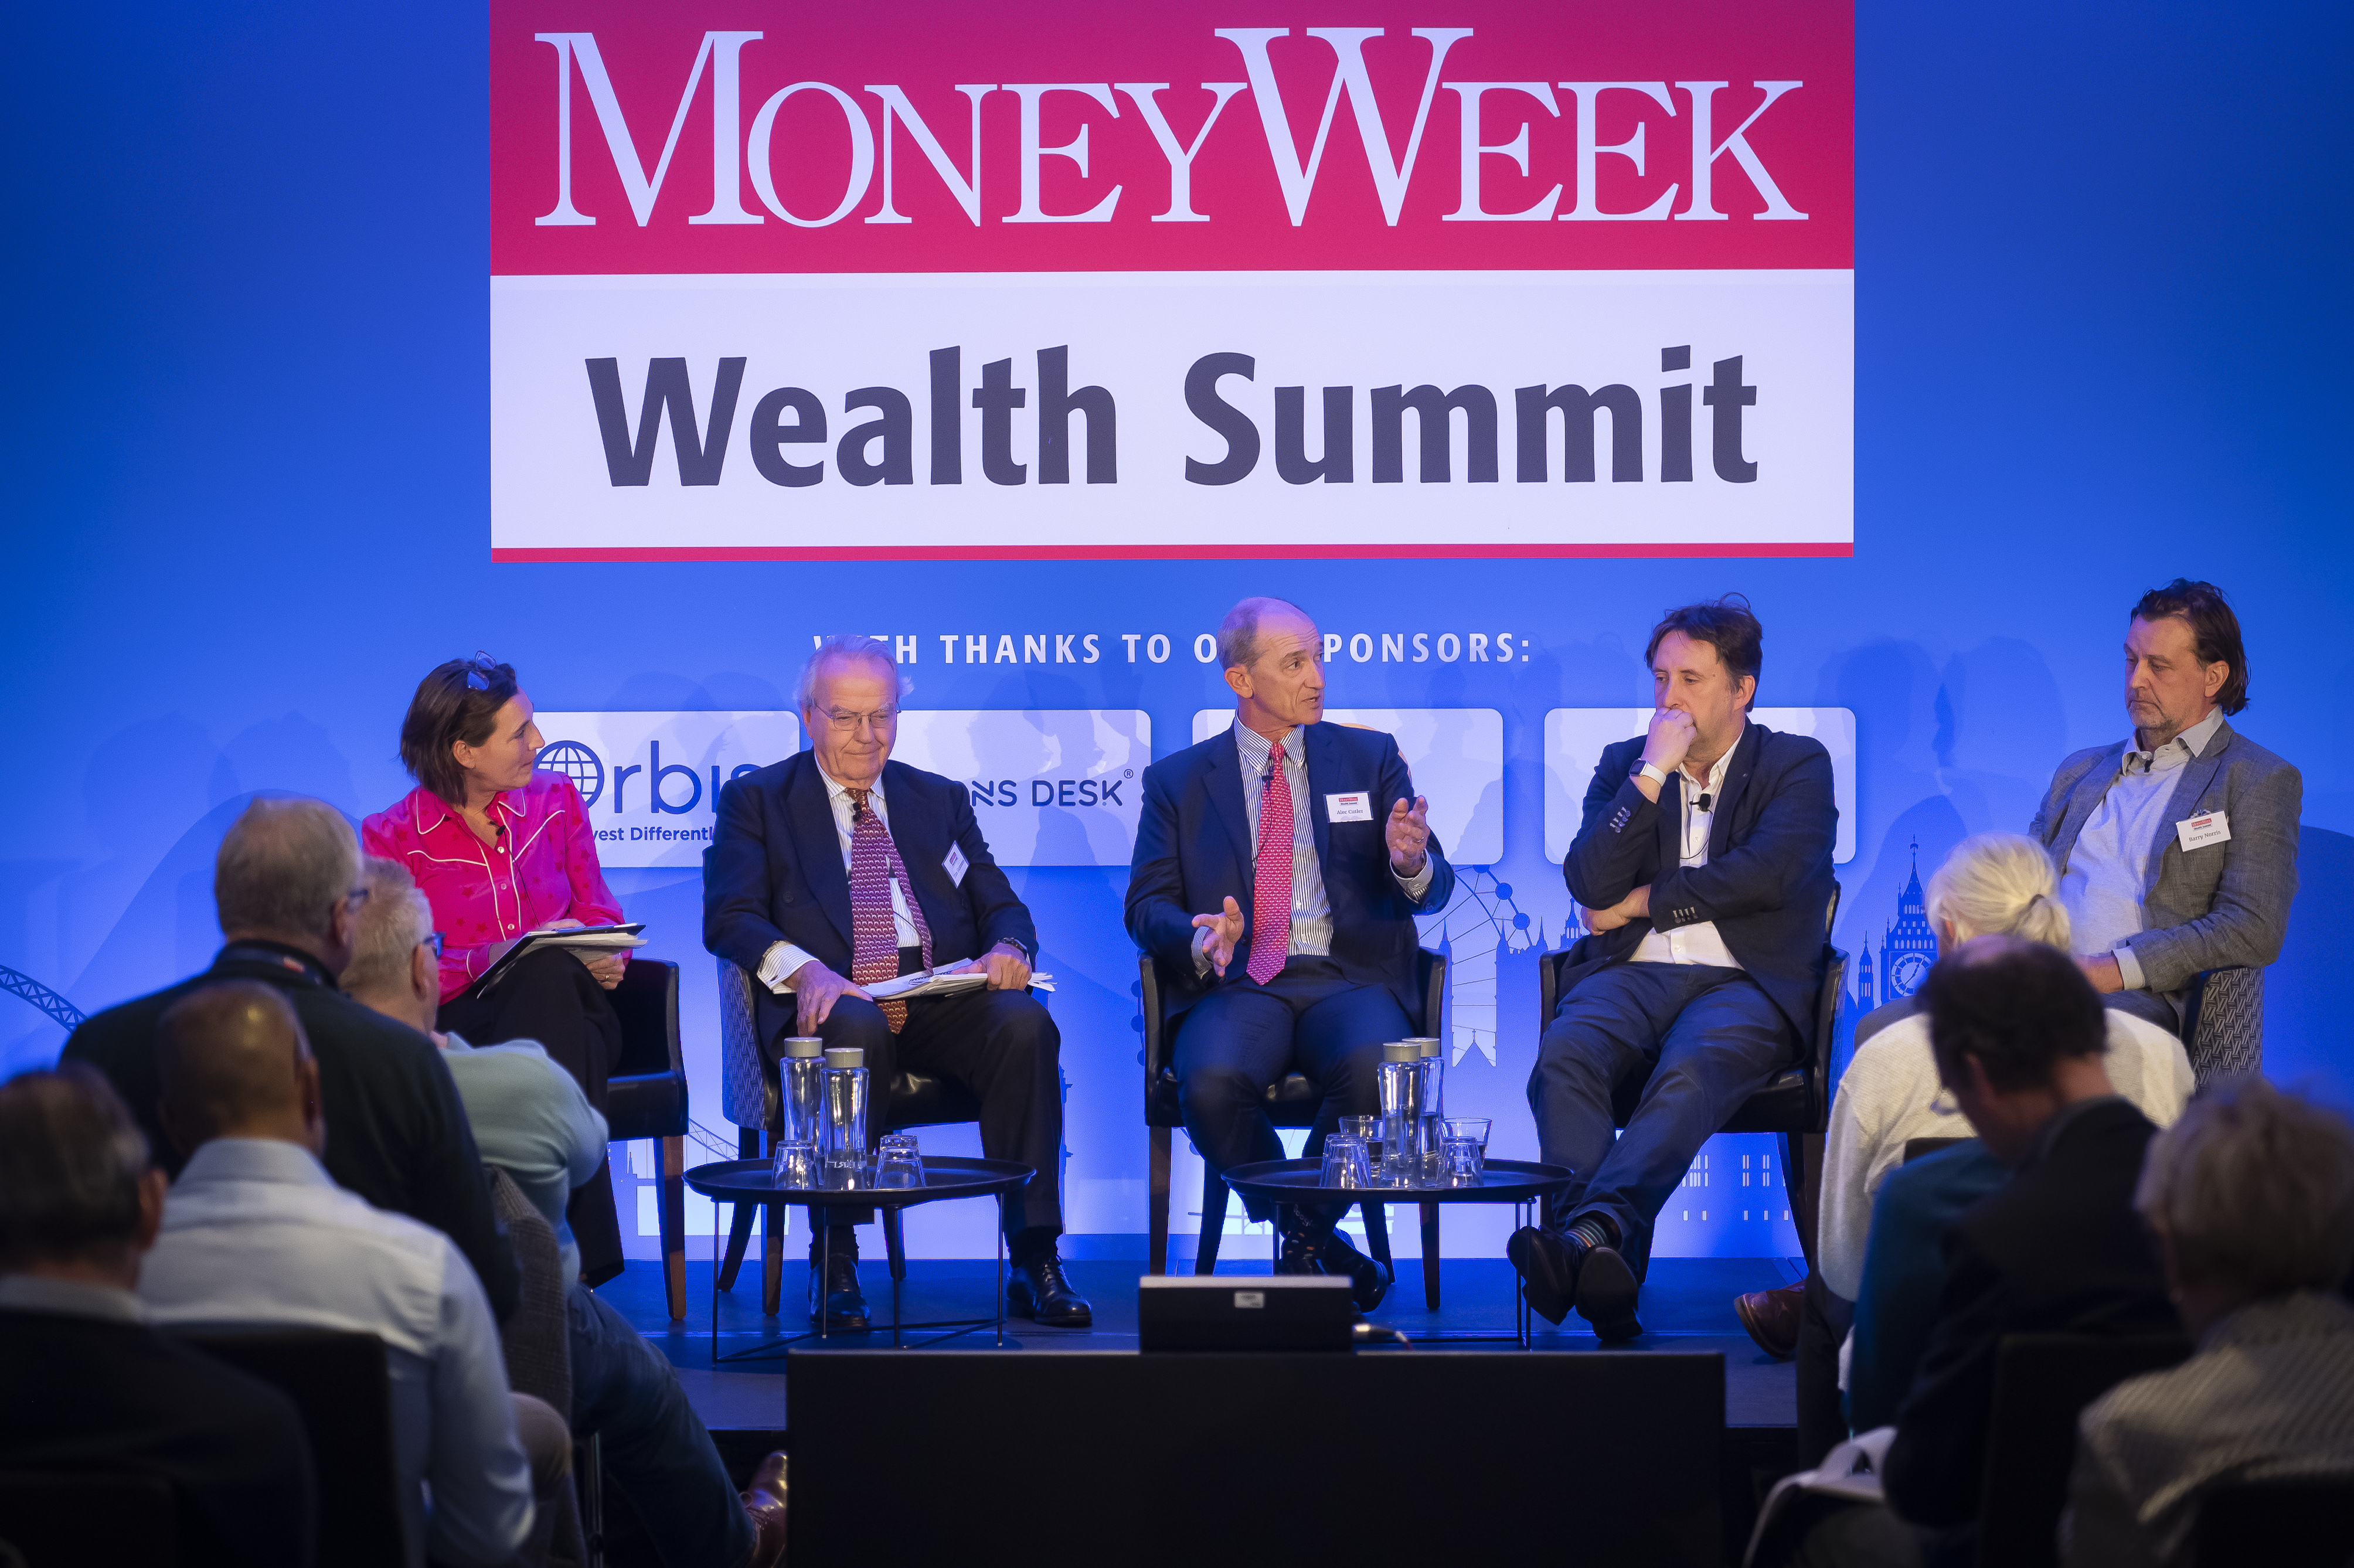 The world’s best bargain stocks
Searching for bargain stocks with Alec Cutler of the Orbis Global Balanced Fund, who tells Andrew Van Sickle which sectors are being overlooked.
-
 Revealed: the cheapest cities to own a home in Britain
New research reveals the cheapest cities to own a home, taking account of mortgage payments, utility bills and council tax


