How “support” and “resistance” can help you spot trading opportunities
Technical analysis can help traders manage risk and decide where to enter and exit a trade. One simple form of technical analysis is the concept of “support” and “resistance”. Dominic Frisby explains how you can make it work for you.
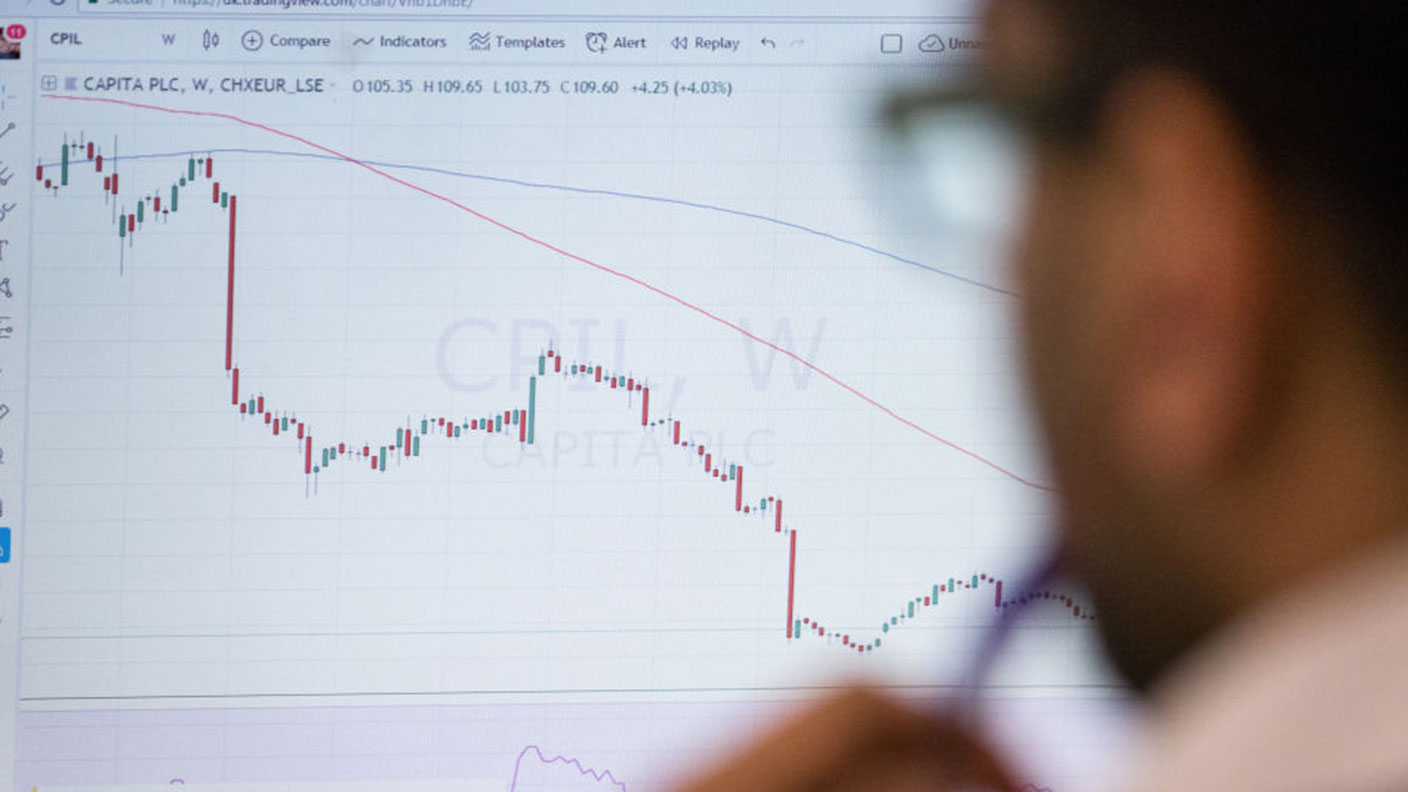
Some say technical analysis – the study of charts and price patterns – is little more than pseudo-scientific mumbo jumbo. You may as well read tea leaves or gaze into the stars. Others swear by it. It has made them their fortune, they say.
I can see both sides of the argument. Different methods suit different personalities. But I like it, and I use it.
You can argue about whether something should be going up, or down, whether it’s overvalued or undervalued, until the cows come home. But ultimately, price is what proves you right or wrong. Every argument about every asset can be boiled down to one thing: its price.
MoneyWeek
Subscribe to MoneyWeek today and get your first six magazine issues absolutely FREE

Sign up to Money Morning
Don't miss the latest investment and personal finances news, market analysis, plus money-saving tips with our free twice-daily newsletter
Don't miss the latest investment and personal finances news, market analysis, plus money-saving tips with our free twice-daily newsletter
Price is truth. And technical analysis is the study of price action.
Here’s why I like technical analysis
I like technical analysis. It helps me to define entry and exit points. It helps me to manage my risk. It enables me to get straight to the heart of the matter. Often you trade an asset profitably, using technical analysis alone, without knowing anything about the asset in question.
Do you know how the cotton market works? Or why a company as large as Unilever, with so many different brands under its umbrella, should be rising or falling? Or what the fundamentals are for the Thai baht in the post-Covid environment?
I can tell you with a great deal of surety that I have no idea. Yet I would be quite comfortable buying or selling any of these on the basis of their price action.
Today let us consider one the most simple, but commonly-applied forms of technical analysis of the lot. That is the concept of “support” and “resistance”.
The terms are self-explanatory really. Support is where a falling price will likely find – well, support. Resistance is where a rising price will run into – well, resistance.
Once you have established a likely area of support, that can mark your buy point. Similarly, if you identify an area of likely resistance, that can mark where you might sell.
Below, for example, we see silver earlier in the year. Trader Pete draws a horizontal line around the $18.80 an ounce mark, because he notices that silver rallies petered out there in September 2019 and then again January 2020 (white arrows). That line marks resistance.
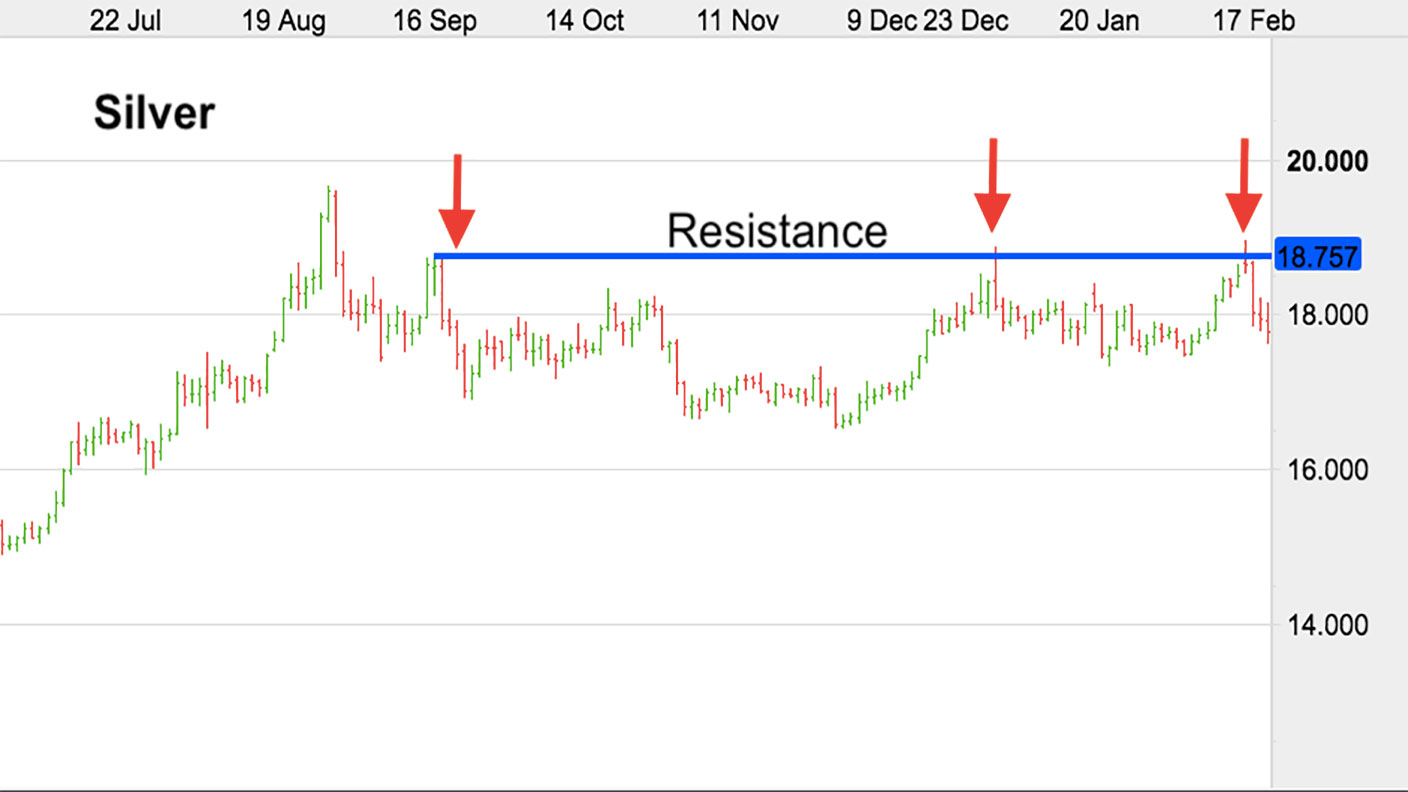
In February, Trader Pete notices silver is approaching that area again. So he sells silver at $18.80. Because Trader Pete is sensible and manages his risk, and the parameters of this trade are clearly defined by the method, Pete also places a stop (a stop loss, where your trade is automatically closed, or “stopped out”) somewhere just above $19.
That gives him a little bit of margin for error, but if the $18.80 no longer proves to be resistance, and silver goes “hi-ho away” and marches upwards, Trader Pete gets stopped out for a small loss.
So – what happened next?
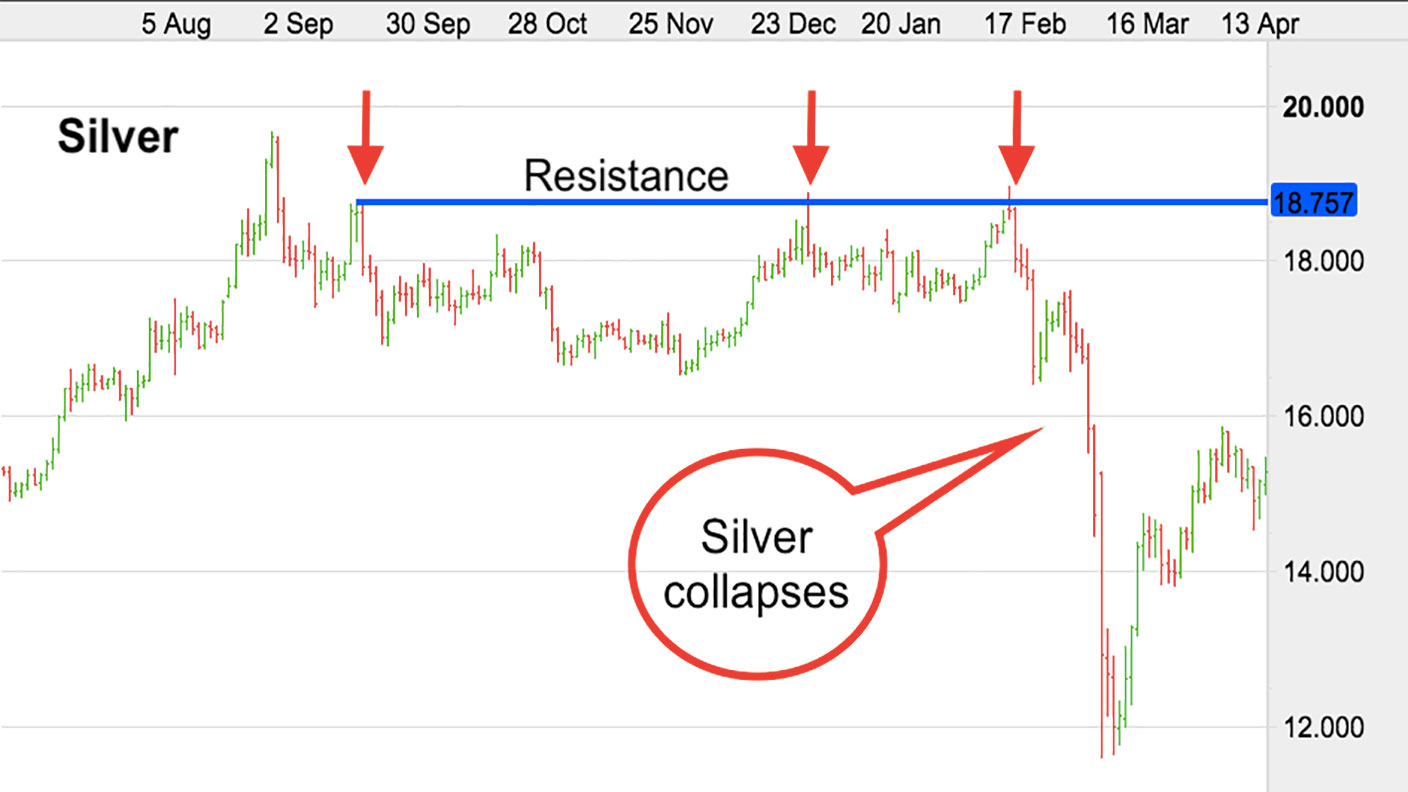
Silver collapsed to $12 – and Trader Pete made out like a bandit.
What happens when support gives way?
But where did Trader Pete buy back?
Trader Pete might have looked back at silver’s recent price history and noted that it had previously found support at $13.80 (white arrows) and drawn a line of support there (purple line). If you had offered him that $5 win when silver was at $18.80, Pete would have bitten your hand off.
As it happened, thanks to the coronavirus panic, silver went a lot lower.
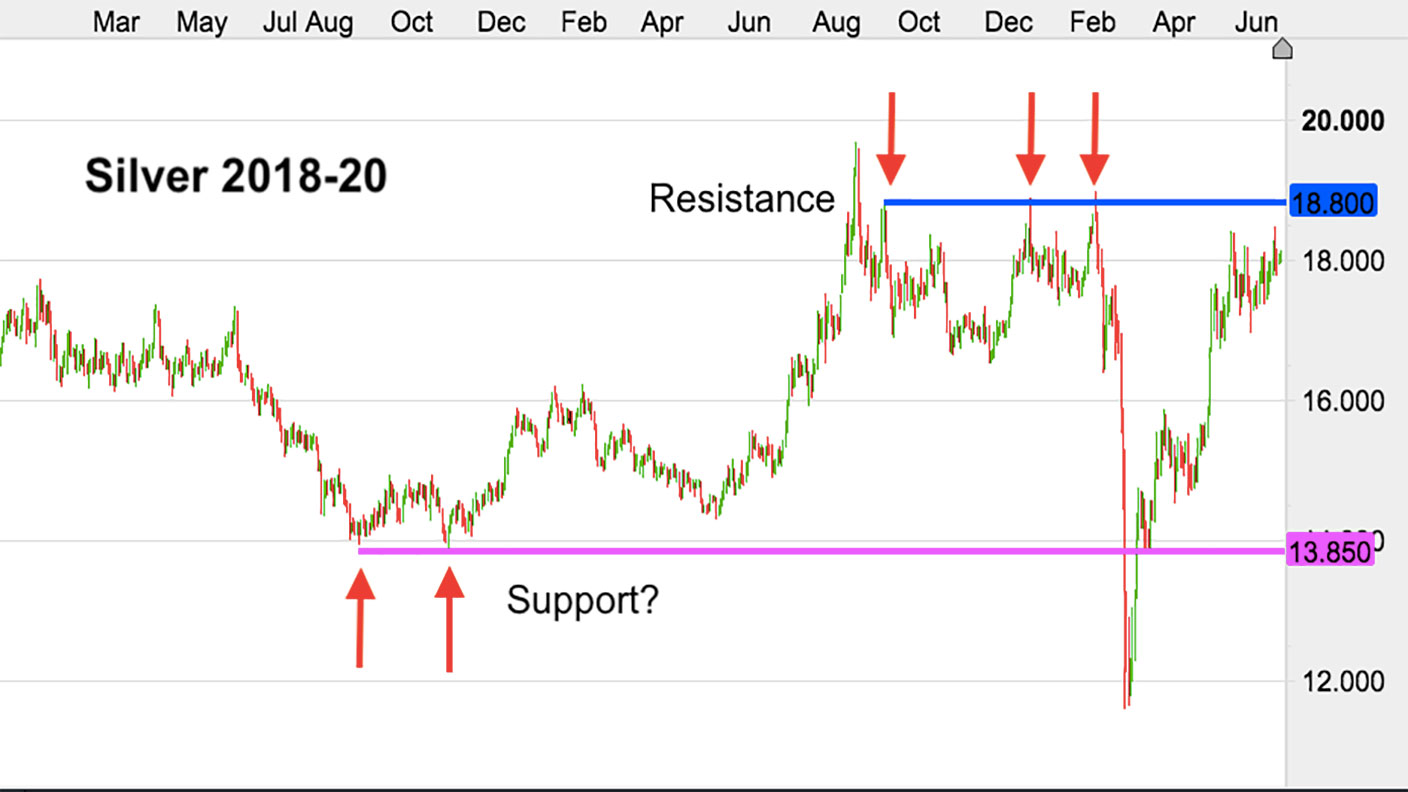
Trader Pete – if he was really smart – might have simply moved his stops up as silver crashed, and thereby secured gains all the way down to $12. But such observations are easy to make in hindsight.
But there you go – that’s a simple example of trading using resistance and support.
You’ll often find that a level which was once resistance, becomes support. Say a price can’t get through $100 and fails on several attempts. Finally, it gets through and marches on up. That $100 then becomes support on corrections.
Similarly in a falling market, say an asset keeps finding support at $50. Finally it sinks through. Subsequent rallies will often then be capped at $50. This doesn’t always work of course, but it’s surprisingly common.
Get the latest financial news, insights and expert analysis from our award-winning MoneyWeek team, to help you understand what really matters when it comes to your finances.

-
 Average UK house price reaches £300,000 for first time, Halifax says
While the average house price has topped £300k, regional disparities still remain, Halifax finds.
-
 Barings Emerging Europe trust bounces back from Russia woes
Barings Emerging Europe trust has added the Middle East and Africa to its mandate, delivering a strong recovery, says Max King
-
 What's behind the big shift in Japanese government bonds?
Rising long-term Japanese government bond yields point to growing nervousness about the future – and not just inflation
-
 Why you should keep an eye on the US dollar, the most important price in the world
Advice The US dollar is the most important asset in the world, dictating the prices of vital commodities. Where it goes next will determine the outlook for the global economy says Dominic Frisby.
-
 What is FX trading?
What is FX trading and can you make money from it? We explain how foreign exchange trading works and the risks
-
 The Burberry share price looks like a good bet
Tips The Burberry share price could be on the verge of a major upswing as the firm’s profits return to growth.
-
 Sterling accelerates its recovery after chancellor’s U-turn on taxes
News The pound has recovered after Kwasi Kwarteng U-turned on abolishing the top rate of income tax. Saloni Sardana explains what's going on..
-
 Why you should short this satellite broadband company
Tips With an ill-considered business plan, satellite broadband company AST SpaceMobile is doomed to failure, says Matthew Partridge. Here's how to short the stock.
-
 It’s time to sell this stock
Tips Digital Realty’s data-storage business model is moribund, consumed by the rise of cloud computing. Here's how you could short the shares, says Matthew Partridge.
-
 Will Liz Truss as PM mark a turning point for the pound?
Analysis The pound is at its lowest since 1985. But a new government often markets a turning point, says Dominic Frisby. Here, he looks at where sterling might go from here.
