Get the latest financial news, insights and expert analysis from our award-winning MoneyWeek team, to help you understand what really matters when it comes to your finances.
You are now subscribed
Your newsletter sign-up was successful
Want to add more newsletters?

Twice daily
MoneyWeek
Get the latest financial news, insights and expert analysis from our award-winning MoneyWeek team, to help you understand what really matters when it comes to your finances.

Four times a week
Look After My Bills
Sign up to our free money-saving newsletter, filled with the latest news and expert advice to help you find the best tips and deals for managing your bills. Start saving today!
Welcome back.
This week’s magazine focuses on Big Tech. The speed at which it has taken over our lives is astonishing, and the amount of data we willingly hand over to the world’s biggest companies defies belief. Sure, we’re getting some fantastically convenient technology in return, but, if you stop to think about it for a little while, the power we’ve relinquished over our lives is quite frightening. Our every move –almost our every thought –can be taken down and may be used in evidence against us. Dominic Frisby takes a look at just what’s possible and asks if Big Tech is morphing into Big Brother. Of course, all this is very profitable, and Dominic also picks some of the sector’s best stocks for your consideration.
In the podcast this week, Merryn talks to Gabrielle Boyle, manager of the Trojan Global Equity fund. Gabrielle explains her investment philosophy, why sustainability and diversity make good business sense, and makes a plea for more women to enter the fund management business. Listen to what she has to say here.
MoneyWeek
Subscribe to MoneyWeek today and get your first six magazine issues absolutely FREE

Sign up to Money Morning
Don't miss the latest investment and personal finances news, market analysis, plus money-saving tips with our free twice-daily newsletter
Don't miss the latest investment and personal finances news, market analysis, plus money-saving tips with our free twice-daily newsletter
This week’s “Too Embarrassed To Ask” video takes a look at Ponzi schemes, perhaps the best-known of the many financial scams people seem to get into, and explains what they are and how they work. Watch that here.
Here are the links for this week’s editions of Money Morning and other web stories you may have missed.
- Tuesday Money Morning: What is hyperinflation and could it happen here?
- Web article: The UK is sitting on its biggest debt pile since WW2. Should you be worried?
- Wednesday Money Morning: Copper has hit a ten-year high, but this could just be the start of a huge bull market
- Web article: Cryptocurrency ether has hit an all-time high. Why? And will the bull market last?
- Thursday Money Morning: Big Tech on steroids: why the 2020s will be the “decade of the DAO”
- Web article: How will India’s Covid crisis affect the global economy?
- Friday Money Morning: Could you end up paying inheritance tax on your family home?
Now for the charts of the week.
The charts that matter
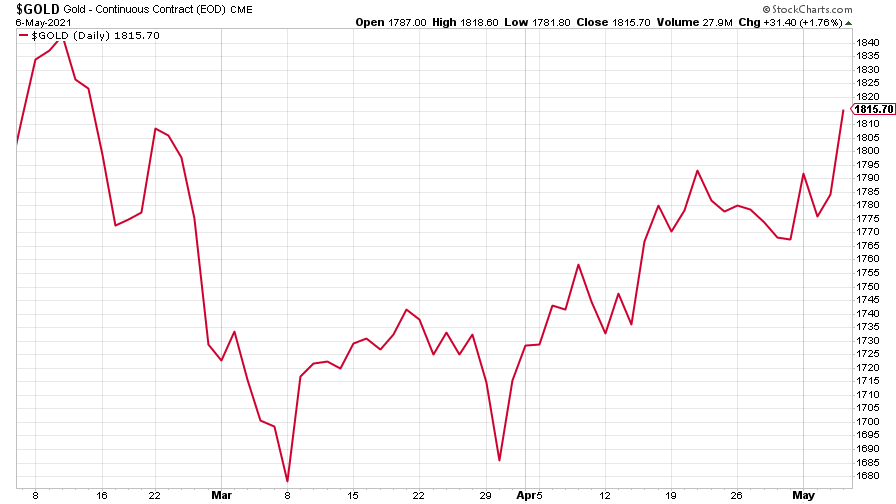
Gold perked up again, continuing its rally after early March’s low.
(Gold: three months)
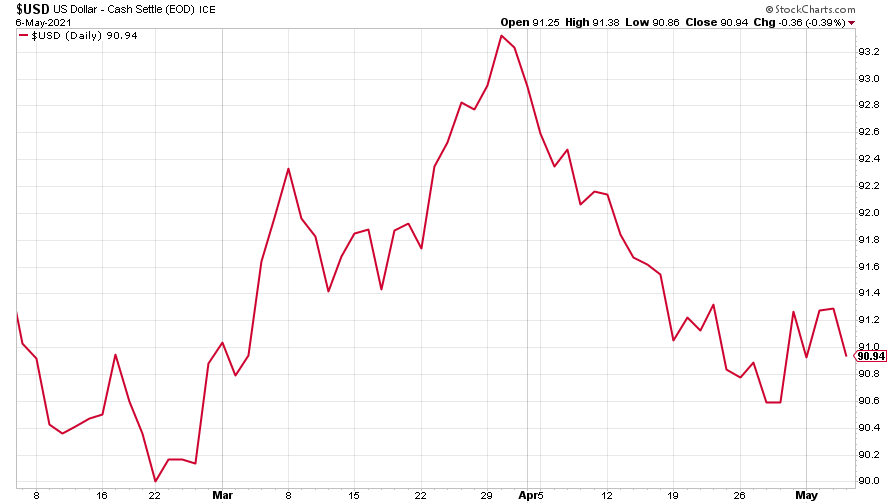
The US dollar index (DXY – a measure of the strength of the dollar against a basket of the currencies of its major trading partners) bounced a little after its recent falls.
(DXY: three months)
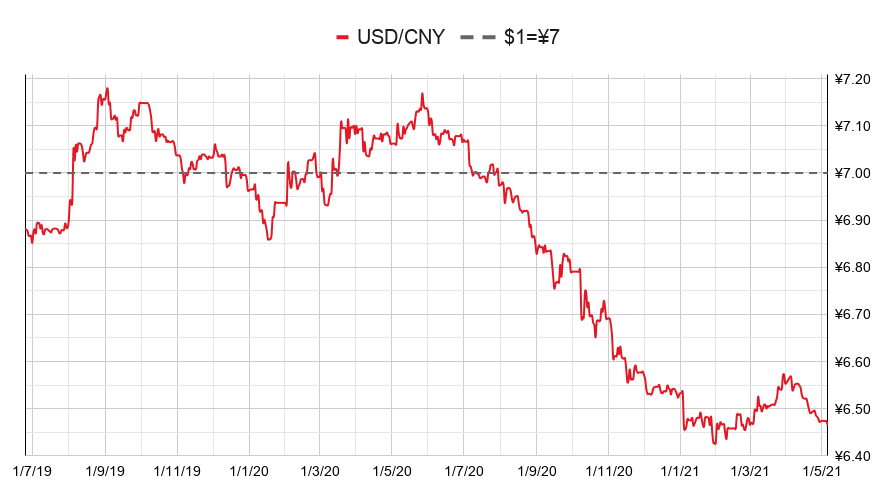
The Chinese yuan (or renminbi) seemed to be treading water against the US dollar (when the red line is rising, the dollar is strengthening while the yuan is weakening).
(Chinese yuan to the US dollar: since 25 Jun 2019)
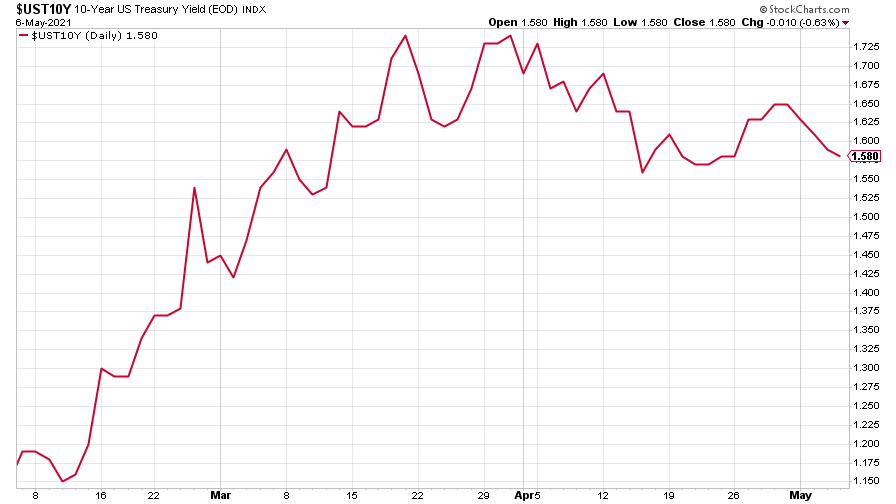
The downward drift in the yield on the ten-year US government bond resumed.
(Ten-year US Treasury yield: three months)
The yield on the Japanese ten-year bond also resumed its decline.
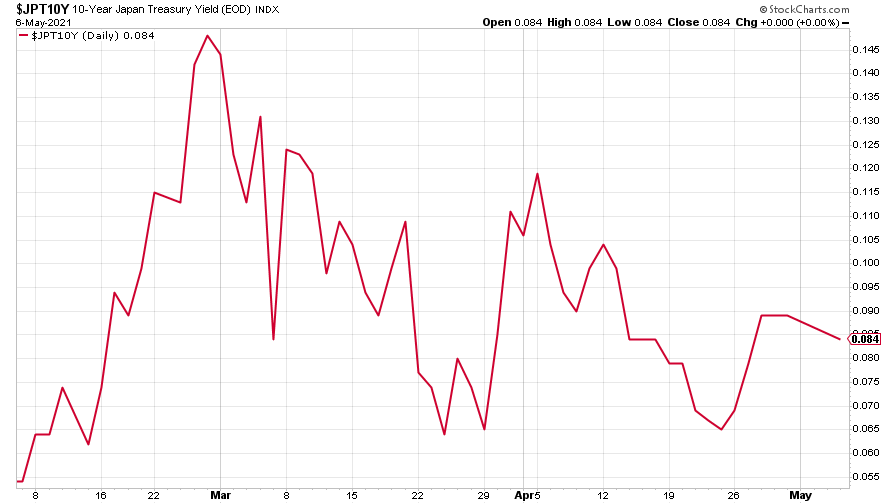
(Ten-year Japanese government bond yield: three months)
The yield on the ten-year German Bund, found the approach to zero a little too rich for its liking, and dropped back.
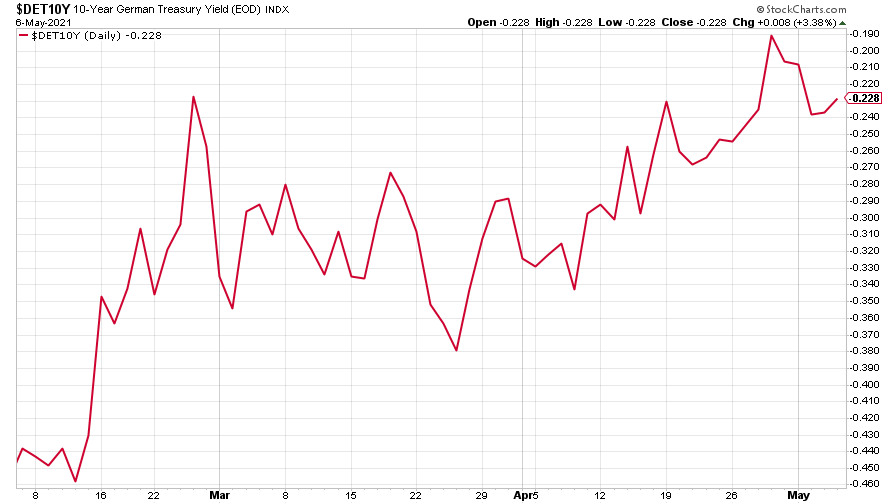
(Ten-year Bund yield: three months)
There was no stopping Copper’s resumption of its bull market, something that’s likely to continue, as Dominic explained on Tuesday.
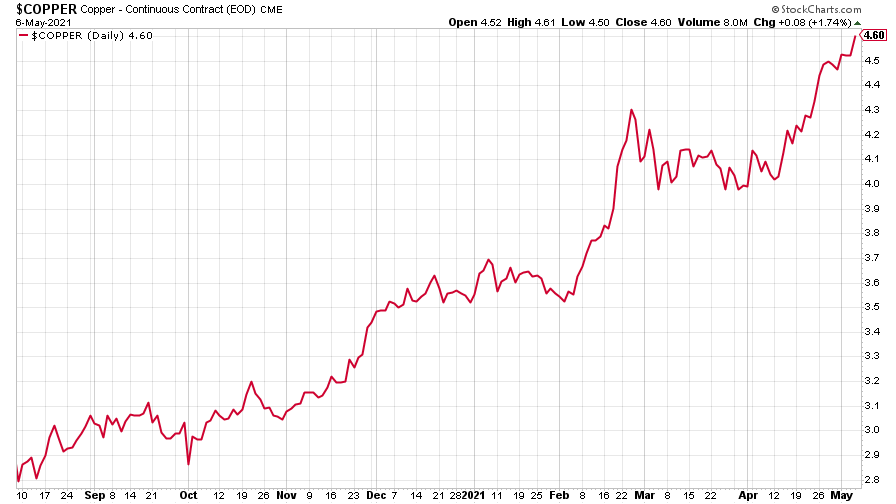
(Copper: nine months)
The closely-related Aussie dollar hasn’t followed the red metal up quite so strongly, however.
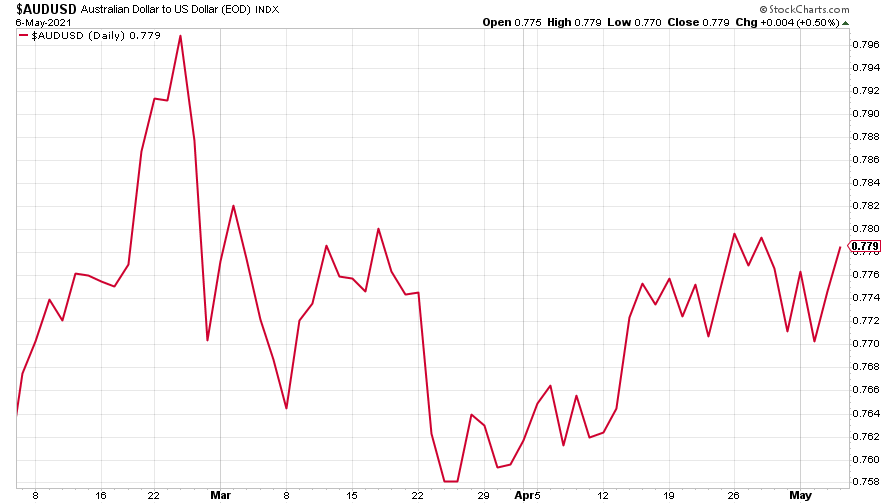
(Aussie dollar vs US dollar exchange rate: three months)
Cryptocurrency bitcoin trod water, in contrast to ether, the second-biggest cryptocurrency, which hit an all time high, as Saloni wrote about this week.
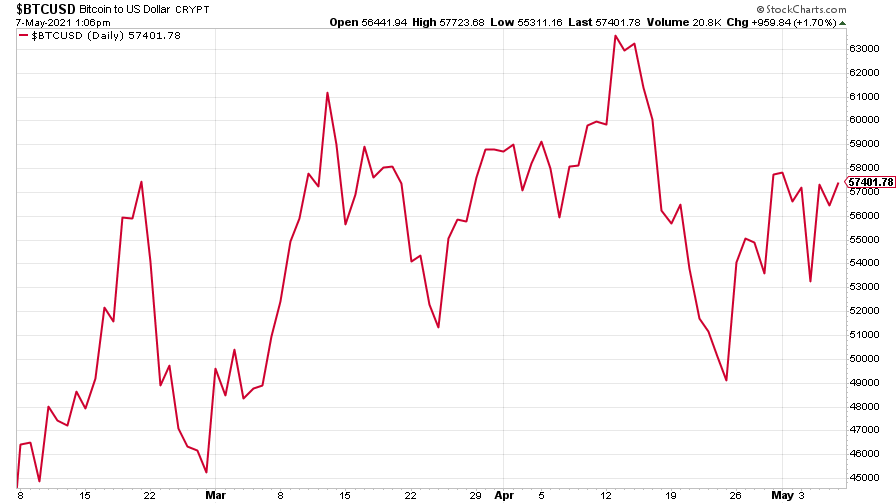
(Bitcoin: three months)
US weekly initial jobless claims continued their decline – down 92,000 to 498,000, compared to 590,000 last week (revised up from 553,000). It’s the lowest number of claims since March 2020. The four-week moving average fell to 560,000, down 61,000 from 621,000 (which was revised down from 611,750) the week before.
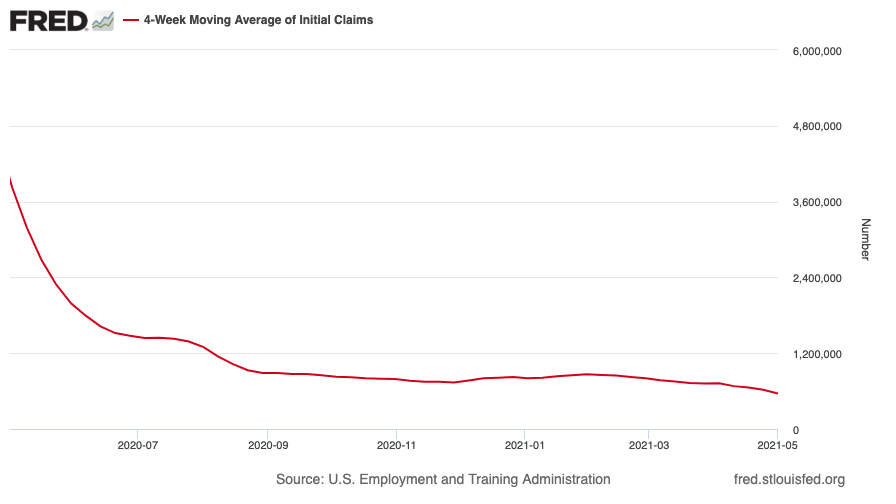
(US initial jobless claims, four-week moving average: since Jan 2020)
The oil price continued to climb.
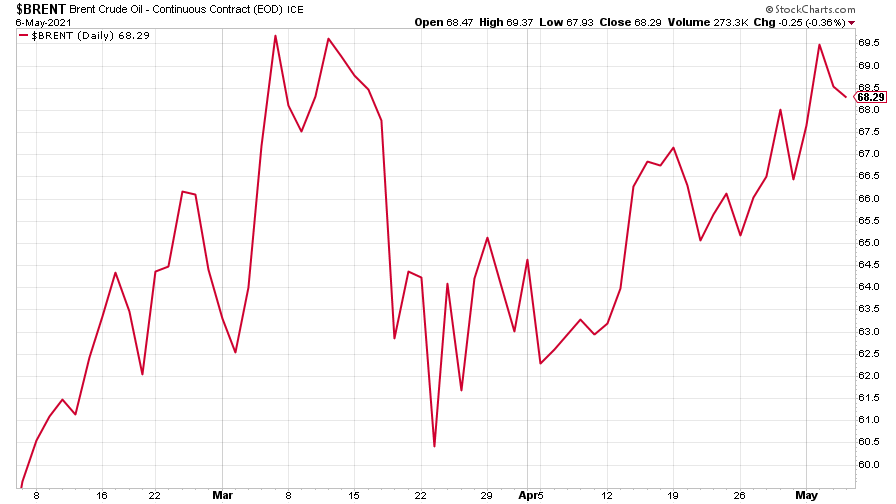
(Brent crude oil: three months)
Amazon hit its highest price for six months or so, but then sold off sharply, despite posting better than expected results. A blip, or a re-start of the “great rotation” out of growth and back to value?
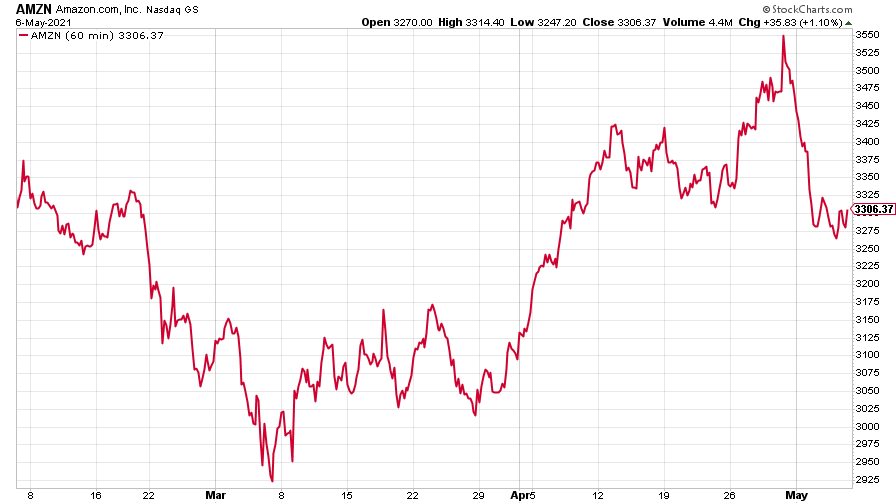
(Amazon: three months)
Tesla continued to fall, too.
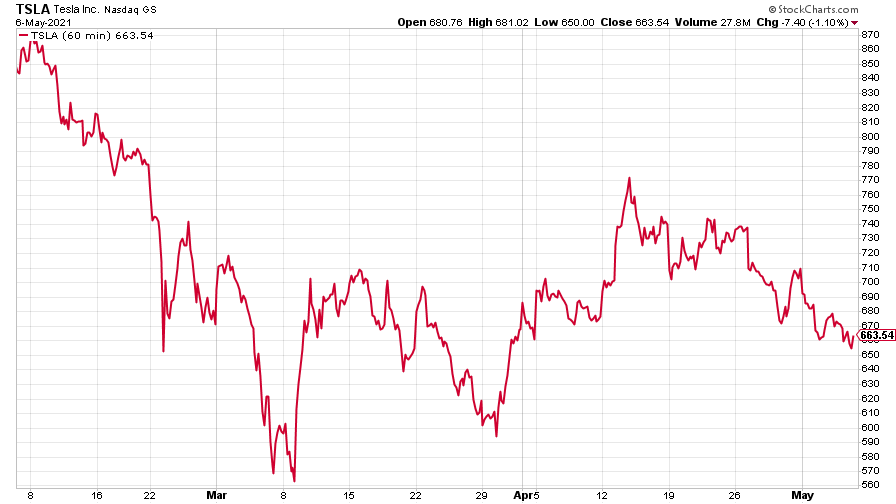
(Tesla: three months)
Have a great weekend.
Ben
Get the latest financial news, insights and expert analysis from our award-winning MoneyWeek team, to help you understand what really matters when it comes to your finances.

-
 Can mining stocks deliver golden gains?
With gold and silver prices having outperformed the stock markets last year, mining stocks can be an effective, if volatile, means of gaining exposure
-
 8 ways the ‘sandwich generation’ can protect wealth
People squeezed between caring for ageing parents and adult children or younger grandchildren – known as the ‘sandwich generation’ – are at risk of neglecting their own financial planning. Here’s how to protect yourself and your loved ones’ wealth.
-
 UK wages grow at a record pace
The latest UK wages data will add pressure on the BoE to push interest rates even higher.
-
 Trapped in a time of zombie government
It’s not just companies that are eking out an existence, says Max King. The state is in the twilight zone too.
-
 America is in deep denial over debt
The downgrade in America’s credit rating was much criticised by the US government, says Alex Rankine. But was it a long time coming?
-
 UK economy avoids stagnation with surprise growth
Gross domestic product increased by 0.2% in the second quarter and by 0.5% in June
-
 Bank of England raises interest rates to 5.25%
The Bank has hiked rates from 5% to 5.25%, marking the 14th increase in a row. We explain what it means for savers and homeowners - and whether more rate rises are on the horizon
-
 UK inflation remains at 8.7% ‒ what it means for your money
Inflation was unmoved at 8.7% in the 12 months to May. What does this ‘sticky’ rate of inflation mean for your money?
-
 Would a food price cap actually work?
Analysis The government is discussing plans to cap the prices of essentials. But could this intervention do more harm than good?
-
 Is my pay keeping up with inflation?
Analysis High inflation means take home pay is being eroded in real terms. An online calculator reveals the pay rise you need to match the rising cost of living - and how much worse off you are without it.
