You are now subscribed
Your newsletter sign-up was successful
Want to add more newsletters?

Twice daily
MoneyWeek
Get the latest financial news, insights and expert analysis from our award-winning MoneyWeek team, to help you understand what really matters when it comes to your finances.

Four times a week
Look After My Bills
Sign up to our free money-saving newsletter, filled with the latest news and expert advice to help you find the best tips and deals for managing your bills. Start saving today!
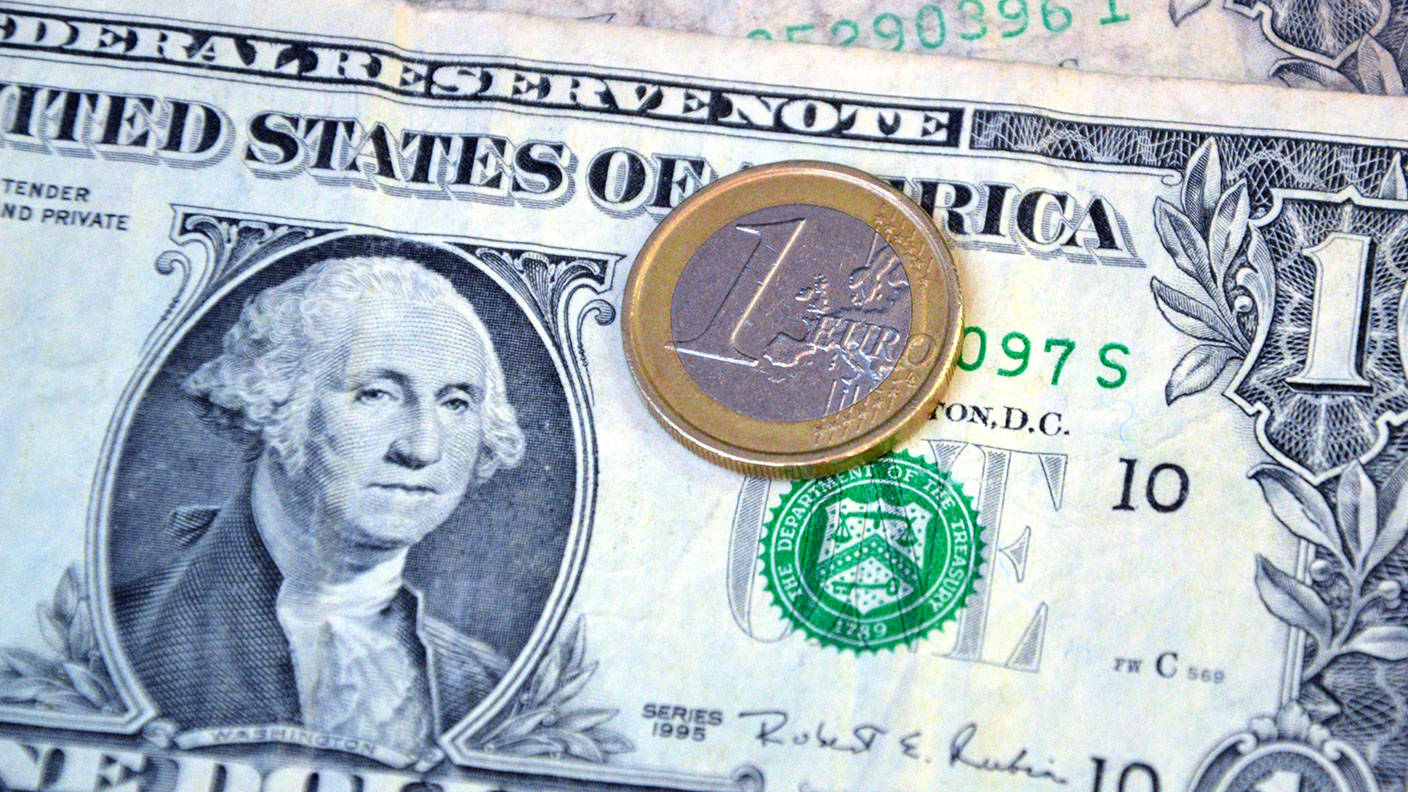
The euro has been through the wringer in 2015.
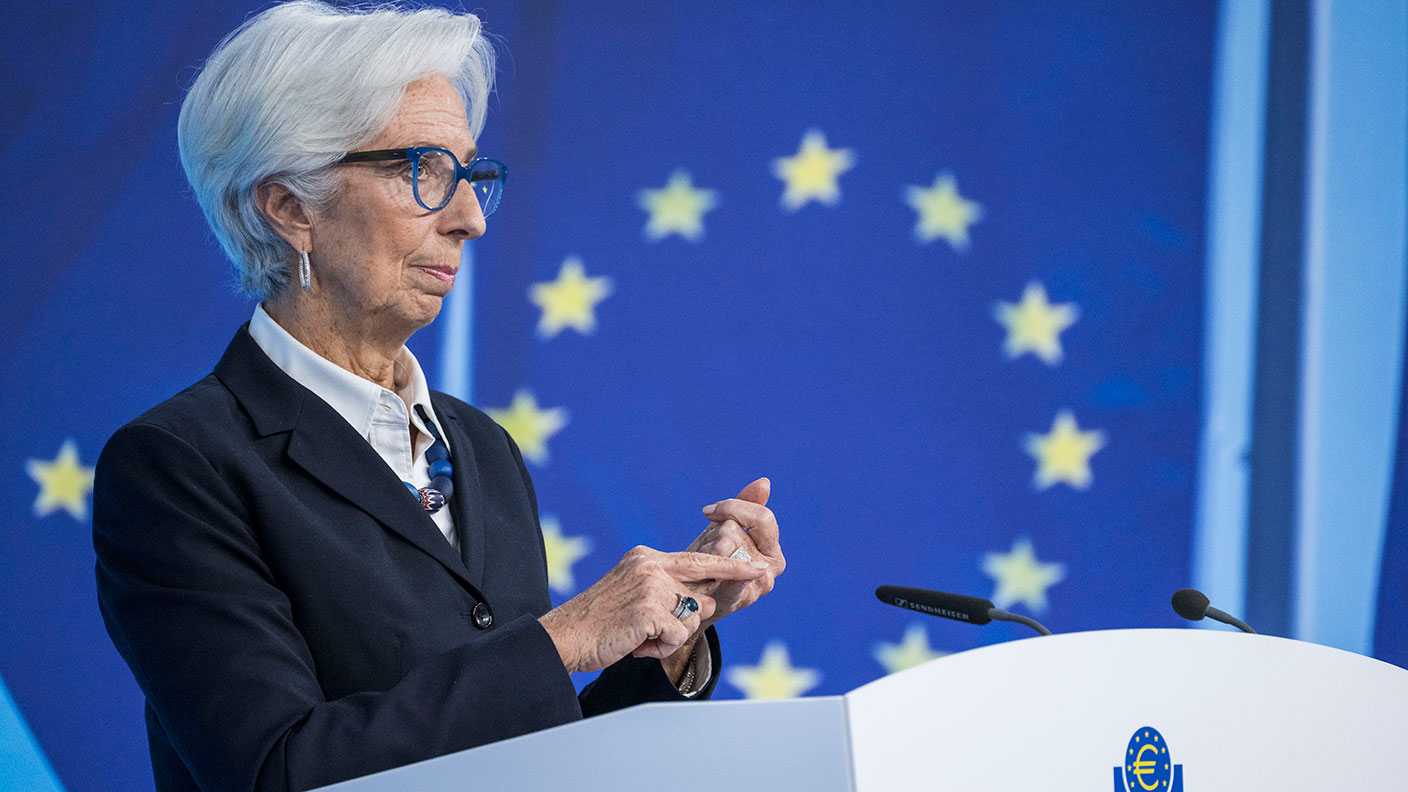
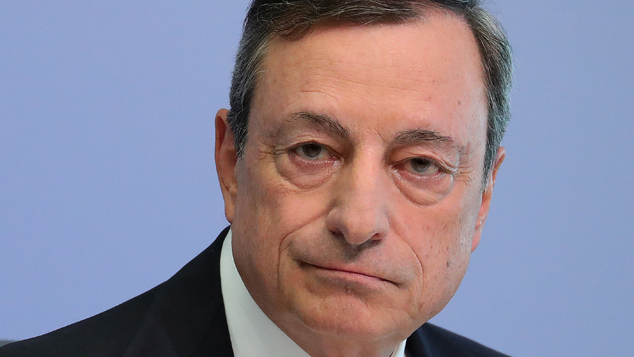
As if Mario Draghi's giant money-printing programme wasn't enough, the latest Greek crisis is sending the euro tumbling.
MoneyWeek
Subscribe to MoneyWeek today and get your first six magazine issues absolutely FREE

Sign up to Money Morning
Don't miss the latest investment and personal finances news, market analysis, plus money-saving tips with our free twice-daily newsletter
Don't miss the latest investment and personal finances news, market analysis, plus money-saving tips with our free twice-daily newsletter
How to pick a trading target using tramlines
Today, I want to use this example to show how my tramline rules can help pinpoint a price target with high accuracy.
In my last post on the euro on 4 February, I showed this hourly chart of the final Elliott wave down to the 1.11 low:
From the December high, the market traced a lovely five-wave pattern down. And the entire move was contained in the trading channel defined by my tramline pair.
Away from the world of charts, in the market during this time rumours were swirling that the European Central Bank (ECB) would finally cave in to a scheme of quantitative easing.
The European bank was the last large-economy central bank to resist QE, following the examples of the US Fed, the Bank of England and the Japanese central bank. Global liquidity was going to be pumped up to even higher levels.
But with the Fed having stopped printing money last year and the ECB about to get started, the EUR/USD market came under severe pressure.
This was a classic sell the rumour and buy the news'. By the time the European Central Bank finally confirmed its money-printing programme, the euro fell to the 1.11 low and started a recovery.
This recovery led to the break of the upper tramline, shown above, in a bullish show of strength.
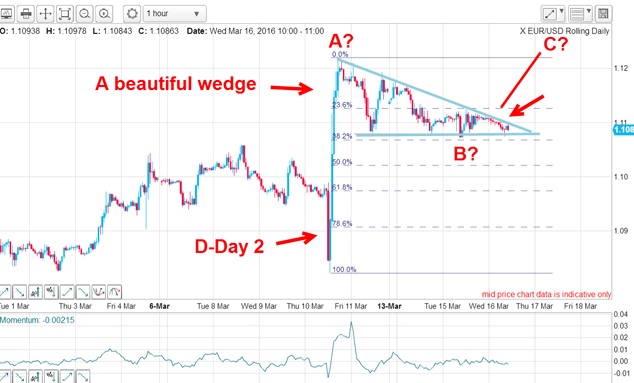
This looks like a turning point
The very first thing I do when I have found a reliable tramline pair and one of the tramlines has been penetrated is to draw in the third tramline. Remember, this is set equidistant from the other two and here it is:
Admittedly, the recovery has been weak, but my target at T3 was hit on Friday.
Now the question is: what now? Will the market push up through T3 or will it sink back down in the new trading channel between the tramlines T3 and the central line?
For clues, we need to zero in on the finer scale. This is the 15-minute chart as I write and I have a possible trade staring at me:
The big reversal on Friday reached just under the 1.1440 level, which lay on the third tramline. Because the third tramline represents a line of resistance, the market is currently bouncing off it.
This morning, it has retreated in a three-wave Elliott wave A-B-C correction to the Fibonacci 62% retrace of Friday's big move.
So, if this level holds, the 62% level could provide the springboard for another assault on the third tramline. After all, the 62% level is the most common retracement if a reversal is on.
The point is this: this Fibonacci level could provide a low-risk trading opportunity for a possible rally because your protective stop could be placed very close to entry.
The other point to keep in mind is this: there is no way any trader could know with certainty which way the market will move. But when you have the odds on your side using well-established trading principles, your chances of success are enhanced.
But whether this particular trade works out is not critical for a professional trader, because they know that over time, they will take a few minor losses, but will also find some major winners and the gains will exceed the losses.
That is all a trader can wish for.
-
 MoneyWeek news quiz: Can you get smart meter compensation?
Smart meter compensation rules, Premium Bonds winners, and the Bank of England’s latest base rate decision all made the news this week. How closely were you following it?
-
 Adventures in Saudi Arabia
Travel The kingdom of Saudi Arabia in the Middle East is rich in undiscovered natural beauty. Get there before everybody else does, says Merryn Somerset Webb


-
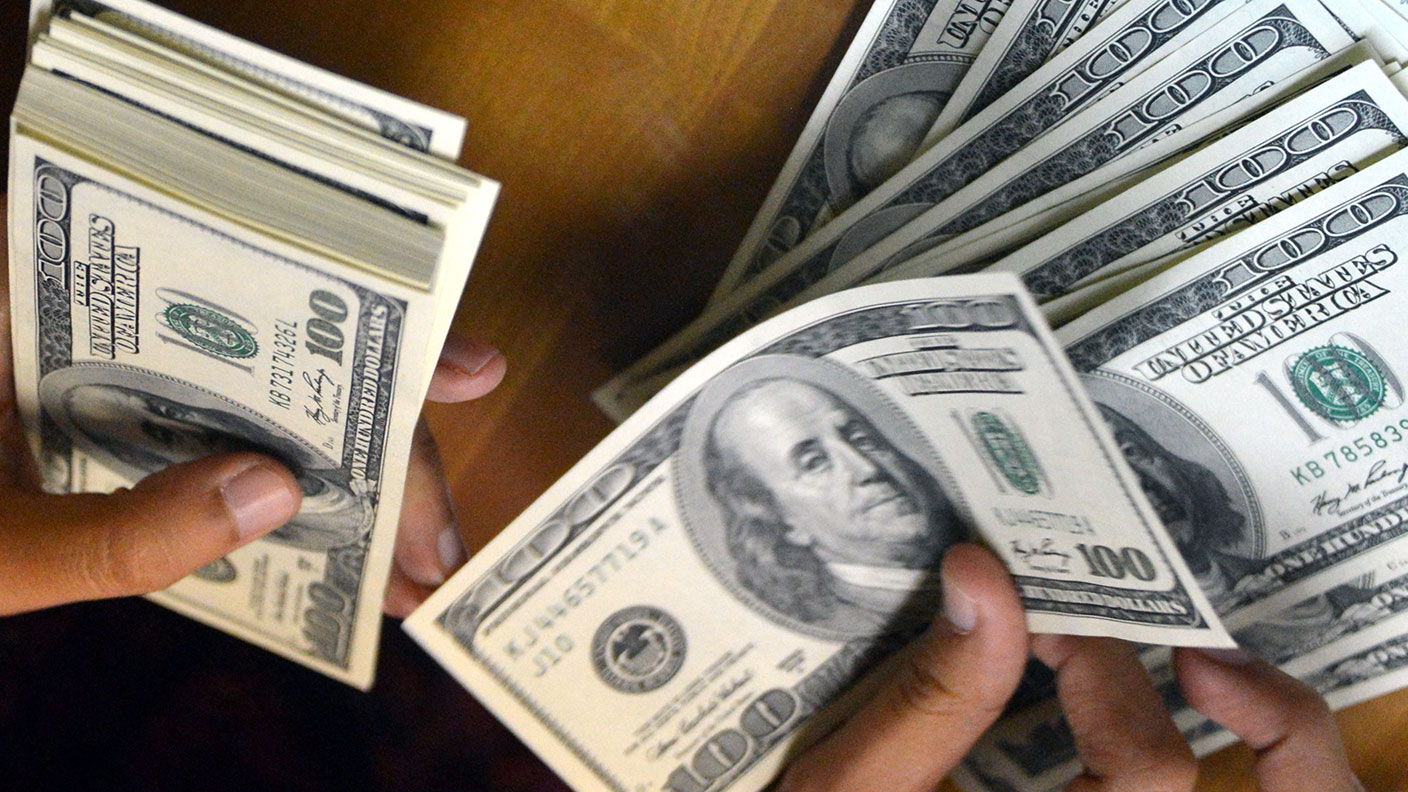
 Investors dash into the US dollar
News The value of the US dollar has soared as investors pile in. The euro has hit parity, while the Japanese yen and the Swedish krona have fared even worse.
-
 Could a stronger euro bring relief to global markets?
Analysis The European Central Bank is set to end its negative interest rate policy. That should bring some relief to markets, says John Stepek. Here’s why.
-
 A weakening US dollar is good news for markets – but will it continue?
Opinion The US dollar – the most important currency in the world – is on the slide. And that's good news for the stockmarket rally. John Stepek looks at what could derail things.
-
 How the US dollar standard is now suffocating the global economy
News In times of crisis, everyone wants cash. But not just any cash – they want the US dollar. John Stepek explains why the rush for dollars is putting a big dent in an already fragile global economy.
-
 The pound could hit parity with the euro – but if it does, buy it
Features Anyone visiting the continent this summer will have been in for a rude shock at the cash till, says Dominic Frisby. But the pound won't stay down forever.
-
 Gold’s rally should continue
Features Matthew Partridge looks at where the gold price is heading next, and what that means for your online trading.
-
 Prudent trades in Prudential
Features John C Burford shows how his trading methods can be used for more than just indices and currencies. They work for large-cap shares too.
-
 Did you find the path of least resistance in EUR/USD?
Features John C Burford outlines a trade in the euro vs the dollar in the wake of the US Federal Reserve’s most recent announcement.


