Did you find the path of least resistance in EUR/USD?
John C Burford outlines a trade in the euro vs the dollar in the wake of the US Federal Reserve’s most recent announcement.
Get the latest financial news, insights and expert analysis from our award-winning MoneyWeek team, to help you understand what really matters when it comes to your finances.
You are now subscribed
Your newsletter sign-up was successful
Want to add more newsletters?

Twice daily
MoneyWeek
Get the latest financial news, insights and expert analysis from our award-winning MoneyWeek team, to help you understand what really matters when it comes to your finances.

Four times a week
Look After My Bills
Sign up to our free money-saving newsletter, filled with the latest news and expert advice to help you find the best tips and deals for managing your bills. Start saving today!
On Wednesday, I set a small exercise in EUR/USD based on the lessons provided by the previous two European Central Bank (ECB) interventions in December (D-Day 1) and the one this month (D-Day 2).
To recap, I found that EUR/USD rallied hard after those two interventions that were intended to weaken it. This seemingly perverse result stemmed from the bearish sentiment towards the euro leading up to the two D-Days.
With this recent history on my side, what were the odds of a similar result on Wednesday evening when the US Federal Reserve was to announce its intentions regarding plans for its monetary interventions?
MoneyWeek
Subscribe to MoneyWeek today and get your first six magazine issues absolutely FREE

Sign up to Money Morning
Don't miss the latest investment and personal finances news, market analysis, plus money-saving tips with our free twice-daily newsletter
Don't miss the latest investment and personal finances news, market analysis, plus money-saving tips with our free twice-daily newsletter
If the Fed expressed a "dovish" forecast for interest rates, would we see a similarly perverse result with the dollar risingand EUR/USD falling? The market certainly expected Janet Yellen to give a firmed-up guide to the timing of the four 0.25% rate rises she had promised last year.
Just before Wednesday, there was a heated debate among Fed-watchers over how many rises she would announce and their timing, but the general feeling was that there would be some timetable laid out.
In the event, there was nothing of the sort. It was all wishy-washy Fed language and that meant most pundits were disappointed. And with no rate increase timetable, the dollar fell this time in a rational reaction.
So history did not repeat itself with a third "perverse" market move. But the rally in EUR/USD was set up beforehand anyway!
This was the hourly chart just beforethe Fed announcement on Wednesday:
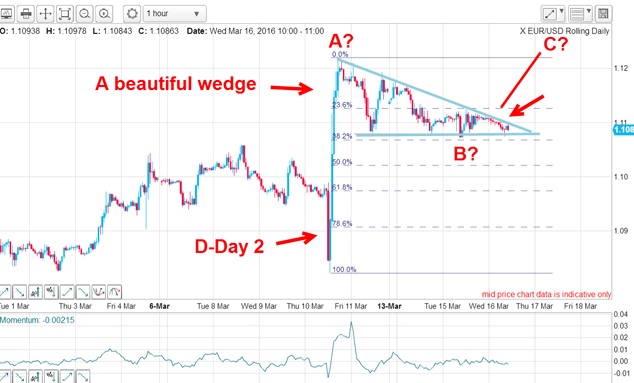
The big rally on D-Day 2 took the market to the 1.12 area and from there the market consolidated its gains inside a very lovely wedge.
Note the pattern inside this wedge it is a textbook five-wave affair with a solid lower support line and solid upper line. This type of wedge pattern often denotes a consolidation phase following a sharp move, and that implies a probable extension to the rally near-term in a vigorous thrust.
So there was a potentially profitable trade by going long. But because I only look for high probability/low-risk trades, I have a natural entry point. That is to enter on a buy-stop order placed just above the upper wedge line. I could have entered that order well before Janet was to speak and potentially shake up the market from its slumber.
To me, this was the path of least resistance. But if wrong, then the market would sell off and most likely not penetrate above the wedge line nor touch off my buy-stop. No damage would result. Remember, part of a successful campaign is not losing money.
Of course, the market did rally hard past my entry buy-stop and I was in with a long position. This is the updated chart:
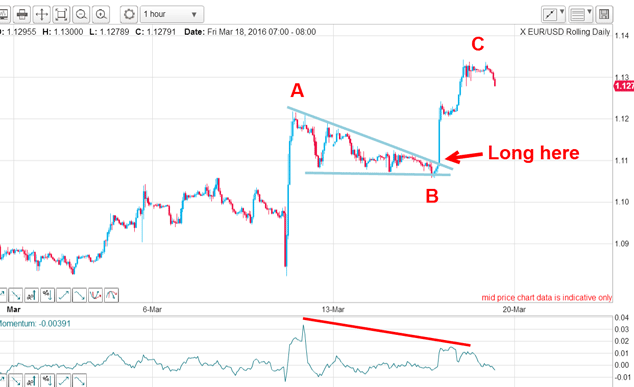
In less than two days, the market rallied by around two cents and this rally could be my C wave of an A-B-C correction to the main trend (down). So is this a good place to take profits?
For one thing, there is the huge momentum divergence staring me in the face. That signals that wave C is weaker than wave A, which is entirely typical for a C wave. A weaker wave means that buying pressure is waning and a reversal could be approaching.
But also, wave C is a Fibonacci 62% multiple of wave A at the 1.1310 area and this is a very common wave relationship.
Odds are stacking up that I have found the top of wave C.
How are these short-term waves fitting into the bigger picture. Here is the daily chart showing my tramlines:
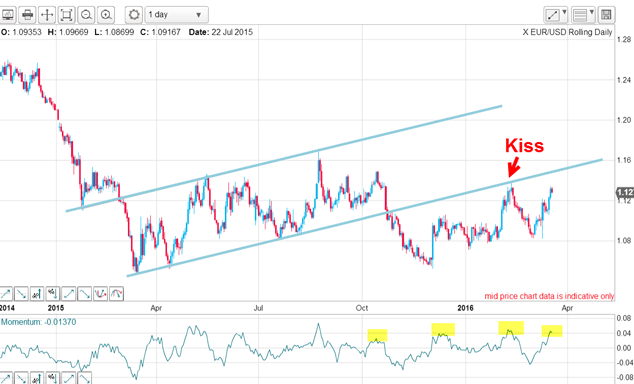
The market first broke below my lower tramline in October and since then has been struggling to get back to it and finally succeeded in planting a kiss last month. And from there, the market went into a traditional and violent "scalded cat bounce" down.
The current rally has produced a high momentum reading from where previous tops were put in. Further gains appear unlikely in the short term.
But now with the market attempting to get back to the line, will it succeed? My short-term goal has been reached, and I am content to bank some profits and await developments.
Get the latest financial news, insights and expert analysis from our award-winning MoneyWeek team, to help you understand what really matters when it comes to your finances.
John is is a British-born lapsed PhD physicist, who previously worked for Nasa on the Mars exploration team. He is a former commodity trading advisor with the US Commodities Futures Trading Commission, and worked in a boutique futures house in California in the 1980s.
He was a partner in one of the first futures newsletter advisory services, based in Washington DC, specialising in pork bellies and currencies. John is primarily a chart-reading trader, having cut his trading teeth in the days before PCs.
As well as his work in the financial world, he has launched, run and sold several 'real' businesses producing 'real' products.
-
 Three companies with deep economic moats to buy now
Opinion An economic moat can underpin a company's future returns. Here, Imran Sattar, portfolio manager at Edinburgh Investment Trust, selects three stocks to buy now
-
 Should you add gold to your pension?
Gold price movements have been eye-catching over the past year. Should you put some gold in your pension?
-
 The challenge with currency hedging
A weaker dollar will make currency hedges more appealing, but volatile rates may complicate the results
-
 It's time to back the yen, says Dominic Frisby
The Japanese yen has been weak for a long time, says Dominic Frisby. That may soon change.
-
 Investors dash into the US dollar
News The value of the US dollar has soared as investors pile in. The euro has hit parity, while the Japanese yen and the Swedish krona have fared even worse.
-
 Why a strong dollar hurts – and what you can do about it
Analysis The US dollar is at its strongest level in 20 years. That’s bad news for most investment assets, says John Stepek – here’s why
-
 Could a stronger euro bring relief to global markets?
Analysis The European Central Bank is set to end its negative interest rate policy. That should bring some relief to markets, says John Stepek. Here’s why.
-
 HubSpot: a tech stock set to tumble
Tips US tech stocks have had a fantastic couple of years. But this year is unlikely to be so bullish for high-fliers that can’t turn big profits.
-
 What does the future hold for central bank digital currencies?
Briefings Many of the world's central banks – including the Bank of England – have expressed an interest in creating their own digital currencies. Shivani Khandekar looks at the state of play in central bank digital currencies.
-
 A weakening US dollar is good news for markets – but will it continue?
Opinion The US dollar – the most important currency in the world – is on the slide. And that's good news for the stockmarket rally. John Stepek looks at what could derail things.