The euro finds support as sentiment plummets
No need to wait for the European Central Bank announcement on Thursday, says John C Burford. Elliott wave theory tells you all you need to know.
Get the latest financial news, insights and expert analysis from our award-winning MoneyWeek team, to help you understand what really matters when it comes to your finances.
You are now subscribed
Your newsletter sign-up was successful
Want to add more newsletters?

Twice daily
MoneyWeek
Get the latest financial news, insights and expert analysis from our award-winning MoneyWeek team, to help you understand what really matters when it comes to your finances.

Four times a week
Look After My Bills
Sign up to our free money-saving newsletter, filled with the latest news and expert advice to help you find the best tips and deals for managing your bills. Start saving today!
I was away last week and since I last wrote, markets have given us some impressive moves, proving that a week is a long time in finance and sometimes, conditions can change even in one day. In fact, last Thursday was just such an occasion when it was all-change in the currency markets with the US dollar suddenly reversing its bull run.
In my last poston the euro on 26 February, I flagged this dollar decline as a high probability event.
And with the avidly-anticipated European Central Bank (ECB)meeting looming on 10 March, where boss Mario Draghi is fully expected to crank up the 'stimulus' machine of more quantitative easing (QE) money-printing and even lower the policy interest rate further into negative territory. That was the overwhelming consensus view and one I was likely to challenge.
MoneyWeek
Subscribe to MoneyWeek today and get your first six magazine issues absolutely FREE

Sign up to Money Morning
Don't miss the latest investment and personal finances news, market analysis, plus money-saving tips with our free twice-daily newsletter
Don't miss the latest investment and personal finances news, market analysis, plus money-saving tips with our free twice-daily newsletter
I had been tracking EUR/USD down off its major top at 1.1360 on 11 February and was looking for a turn. I had identified a likely minor low with the hit on the meeting of the tramline and the Fibonacci 62% support level. Here is the chart I showed:
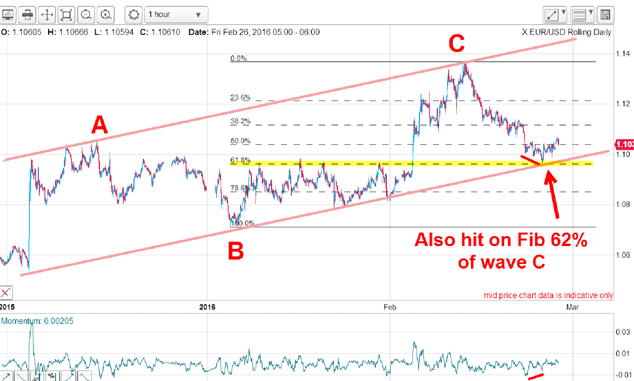
The market was also entering chart congestion from the December-January period which I expected to provide some support. That area was a good place to take at least partial profits on short trades, as I pointed out.
But the decline had not stopped there with the market moving lower to break my lower pink tramline to take it deeper into the congestion zone. It was then that I sensed that the inevitable rebound was going to be sharp. The selling had to be intense to take the market well below my pink tramline with an associated increase in short bets placed by speculators (which would be revealed by the latest Commitments of traders (COT) data).
Sure enough, that is precisely what the COT data shows. This is the snapshot as of last Tuesday (only released on Friday) two days before the fateful snap-back rally:
| (Contracts of EUR 125,000) | Row 0 - Cell 1 | Row 0 - Cell 2 | Row 0 - Cell 3 | Open interest: 503,904 | ||||
| Commitments | ||||||||
| 105,765 | 165,932 | 57,339 | 291,418 | 212,752 | 454,522 | 436,023 | 49,383 | 67,882 |
| Changes from 02/23/16 (Change in open interest: 6,180) | ||||||||
| -3,445 | 20,704 | 5,100 | 7,472 | -27,696 | 9,126 | -1,892 | -2,946 | 8,072 |
| Percent of open in terest for each category of traders | ||||||||
| 21.0 | 32.9 | 11.4 | 57.8 | 42.2 | 90.2 | 86.5 | 9.8 | 13.5 |
| Number of traders in each category (Total traders: 241) | ||||||||
| 65 | 96 | 69 | 57 | 60 | 159 | 188 | Row 8 - Cell 7 | Row 8 - Cell 8 |
Both hedge funds (non-commercials) and small traders (non-reportables) massively increased their short bets in the previous week (while the smart money commercials took the other side of that bet). The bear trap had been sprung.
And this is the result here is the updated hourly chart:
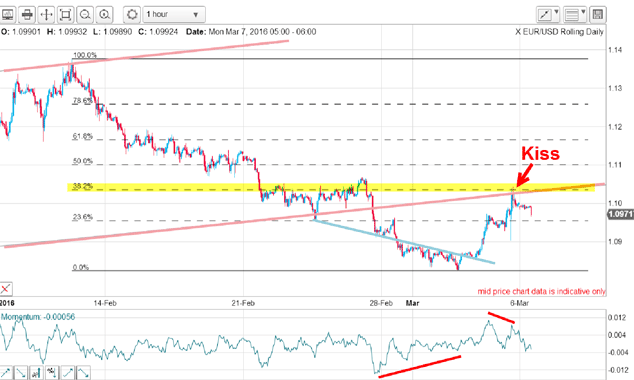
With a huge momentum divergence forming last week, the market broke cleanly above my blue trendline on Thursday and rocketed up in a massive short squeeze for a 200-pip two-day gain. Short-term traders were delighted.
But on Friday, the market hit major resistance with a traditional tramline kiss which also was the Fibonacci 38% resistance level.
So this morning, the shorts must be wondering what happened and is their assumption that Draghi will serve to drive the euro lower on Thursday still valid, even though a 'stimulus' package may well be unveiled?
There is little doubt that much of the selling off the 1.1360 high was done by traders who took the party line that whenever central banks engage in "stimulus", it must weaken the currency (that is their intent, after all). In four days, this theory will be put to the test (again).
But the omens are not good. In January, Japan unleashed its historic stimulus and drove its policy rate into the negative for the first time ever. And what did the yen do? It rose strongly in the following weeks. That was a great example of a "buy the rumour, sell the news" trade and was contrary to received "wisdom".
But has last week's sharp euro rally changed the immediate outlook? Here is a close-up of the hourly:
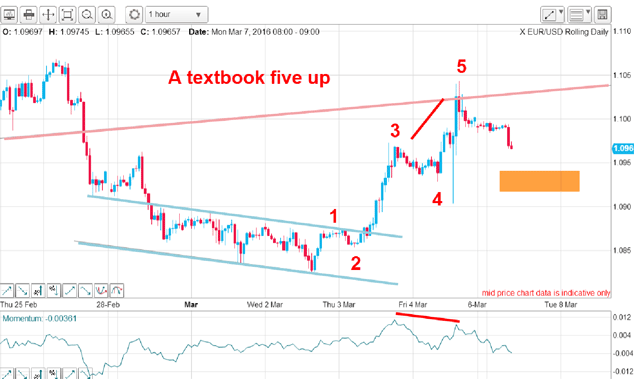
In fact, the rally possesses a classic five up with a long and strong wave 3, a fifth wave to new highs (which itself contains a nice five up), and a momentum divergence at the wave 5 high. This is entirely textbook and heralds a major change in direction.
And if the textbook examples are to be maintained, I expect a pull-back in an A-B-C form to take the market to at least into the marked orangezone, which is the region of the wave 4 low (a common target for A-B-C pull-backs).
One of the major advantages of using the Elliott wave theory is that it offers a high probability roadmap for the market to follow in all time scales. Here, I have shown that the new five up, which usually signals a change of trend when it appears after a lengthy decline, is hinting that the new trend for the euro is up.
But at least until Thursday, the market will remain highly volatile.
Get the latest financial news, insights and expert analysis from our award-winning MoneyWeek team, to help you understand what really matters when it comes to your finances.
John is is a British-born lapsed PhD physicist, who previously worked for Nasa on the Mars exploration team. He is a former commodity trading advisor with the US Commodities Futures Trading Commission, and worked in a boutique futures house in California in the 1980s.
He was a partner in one of the first futures newsletter advisory services, based in Washington DC, specialising in pork bellies and currencies. John is primarily a chart-reading trader, having cut his trading teeth in the days before PCs.
As well as his work in the financial world, he has launched, run and sold several 'real' businesses producing 'real' products.
-
 Should you buy an active ETF?
ETFs are often mischaracterised as passive products, but they can be a convenient way to add active management to your portfolio
-
 Power up your pension before 5 April – easy ways to save before the tax year end
With the end of the tax year looming, pension savers currently have a window to review and maximise what’s going into their retirement funds – we look at how
-
 Investors dash into the US dollar
News The value of the US dollar has soared as investors pile in. The euro has hit parity, while the Japanese yen and the Swedish krona have fared even worse.
-
 Could a stronger euro bring relief to global markets?
Analysis The European Central Bank is set to end its negative interest rate policy. That should bring some relief to markets, says John Stepek. Here’s why.
-
 A weakening US dollar is good news for markets – but will it continue?
Opinion The US dollar – the most important currency in the world – is on the slide. And that's good news for the stockmarket rally. John Stepek looks at what could derail things.
-
 How the US dollar standard is now suffocating the global economy
News In times of crisis, everyone wants cash. But not just any cash – they want the US dollar. John Stepek explains why the rush for dollars is putting a big dent in an already fragile global economy.
-
 The pound could hit parity with the euro – but if it does, buy it
Features Anyone visiting the continent this summer will have been in for a rude shock at the cash till, says Dominic Frisby. But the pound won't stay down forever.
-
Gold’s rally should continue
Features Matthew Partridge looks at where the gold price is heading next, and what that means for your online trading.
-
 Prudent trades in Prudential
Features John C Burford shows how his trading methods can be used for more than just indices and currencies. They work for large-cap shares too.
-
 Did you find the path of least resistance in EUR/USD?
Features John C Burford outlines a trade in the euro vs the dollar in the wake of the US Federal Reserve’s most recent announcement.