The euro heads for my target – but not yet
The euro is throwing up textbook examples of how to apply trading methods to the charts, says John C Burford. The excitement continues.
Get the latest financial news, insights and expert analysis from our award-winning MoneyWeek team, to help you understand what really matters when it comes to your finances.
You are now subscribed
Your newsletter sign-up was successful
Want to add more newsletters?

Twice daily
MoneyWeek
Get the latest financial news, insights and expert analysis from our award-winning MoneyWeek team, to help you understand what really matters when it comes to your finances.

Four times a week
Look After My Bills
Sign up to our free money-saving newsletter, filled with the latest news and expert advice to help you find the best tips and deals for managing your bills. Start saving today!
On Wednesday, I explained how I have been finding the few very high probability/low risk trades in EUR/USD as it progressed through its very complex fourth wave pattern.
But when it hit my major target at the 1.1360 level, I believed that was the most likely wave 4 high.
The move down since then has helped confirm my view that the market is in the early stages of its final fifth wave of this sequence.
MoneyWeek
Subscribe to MoneyWeek today and get your first six magazine issues absolutely FREE

Sign up to Money Morning
Don't miss the latest investment and personal finances news, market analysis, plus money-saving tips with our free twice-daily newsletter
Don't miss the latest investment and personal finances news, market analysis, plus money-saving tips with our free twice-daily newsletter
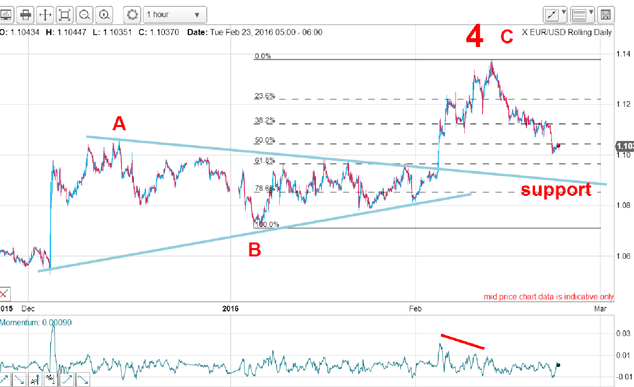
This was the hourly chart I showed then:

The final thrust up to my target emerged from a lengthy wedge pattern. The upper wedge line was strong resistance before the break, but must now beconsidered strong support from where sharp rallies can be mounted.
But now that the market is entering below the December wave A high, we must consider other levels from which decent bounces can be staged and here is a classic target derived from my tramline method.
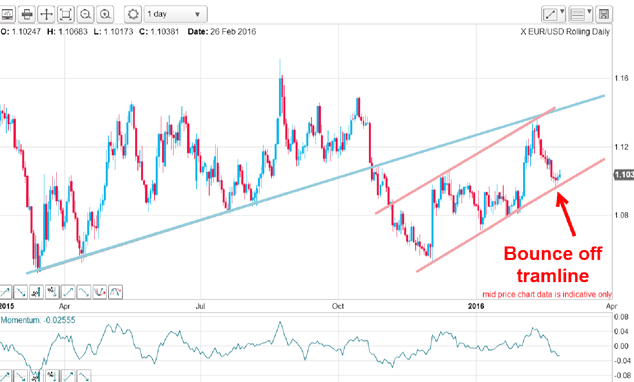
This is the updated chart:

The blue line is my long-term lower tramline drawn off the wave 3 low of last March. Now, with the decline off the 1.1360 high, I can draw a new and smaller tramline pair in pink.
The two highs line up beautifully and the lower line passes through accurate hits on the lows of this A-B-C pattern. So last week, the lower tramline became a target for a bounce, because lower tramlines are always line of support.
Isn't that pretty? The market is currently bouncing up off this line. Note the crossover of the blue and pink tramlines in what I call a "Chinese hat". This is a particularly strong area of resistance.
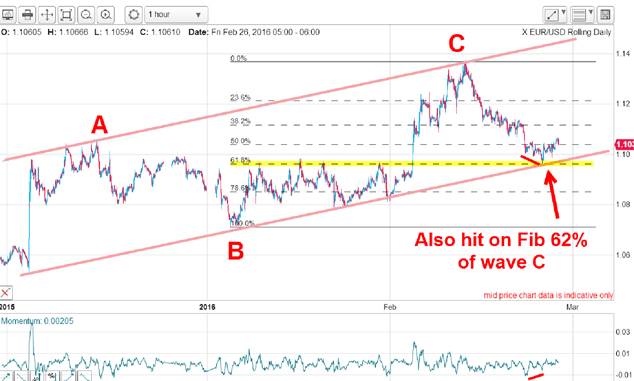
Here is a close-up of this action:

Not only did the market hit the lower tramline on Wednesday, but that was also where the Fibonacci 62% retrace of wave C was sitting. And the hit was on a small momentum divergence.
This is a textbook setup for a counter-trend rally and that is precisely what we are seeing.
That low at the 1.0960 level on Wednesday was the perfect place to take short-term profits of a few hundreds of pips. In fact, that low was a target that anyone using my methods could have used ahead of time to plan their trade.
It is a great example of how to analyse where a likely high is to be made (at the 1.1360 level), how to set a stop loss if wrong, then plan targets where profits could be taken, and set orders up ahead of time to take those profits.
If this became an automatic routine for you, then you have the odds very much on your side to become a very serious and profitable trader.
Now that the market has given me confirmation that a counter-trend rally is in progress, I can now plan my next move.
Because odds are high that wave 5 down has started, I am looking for a five-wave pattern to form within this final wave. That is my ideal scenario.
One possible option is that the move down to the Wednesday low is my wave 1 down and the current bounce is part of wave 2. That view would be confirmed with a stronger bounce than has occurred so far.
But if the market fails to rally from here it would be in danger of breaking my lower pink tramline support, and that would herald a steeper decline, thereby postponing my wave 1 low.
Whatever happens, odds favour a stair-step decline through the wedge congestion zone. But if selling became intense, the bounces would be brief and small and my forecast for parity would heave into view.
The euro excitement continues.
Get the latest financial news, insights and expert analysis from our award-winning MoneyWeek team, to help you understand what really matters when it comes to your finances.
John is is a British-born lapsed PhD physicist, who previously worked for Nasa on the Mars exploration team. He is a former commodity trading advisor with the US Commodities Futures Trading Commission, and worked in a boutique futures house in California in the 1980s.
He was a partner in one of the first futures newsletter advisory services, based in Washington DC, specialising in pork bellies and currencies. John is primarily a chart-reading trader, having cut his trading teeth in the days before PCs.
As well as his work in the financial world, he has launched, run and sold several 'real' businesses producing 'real' products.
-
 Average UK house price reaches £300,000 for first time, Halifax says
While the average house price has topped £300k, regional disparities still remain, Halifax finds.
-
 Barings Emerging Europe trust bounces back from Russia woes
Barings Emerging Europe trust has added the Middle East and Africa to its mandate, delivering a strong recovery, says Max King