Prudent trades in Prudential
John C Burford shows how his trading methods can be used for more than just indices and currencies. They work for large-cap shares too.
Get the latest financial news, insights and expert analysis from our award-winning MoneyWeek team, to help you understand what really matters when it comes to your finances.
You are now subscribed
Your newsletter sign-up was successful
Want to add more newsletters?

Twice daily
MoneyWeek
Get the latest financial news, insights and expert analysis from our award-winning MoneyWeek team, to help you understand what really matters when it comes to your finances.

Four times a week
Look After My Bills
Sign up to our free money-saving newsletter, filled with the latest news and expert advice to help you find the best tips and deals for managing your bills. Start saving today!
As regular readers know, I love to poke fun at central bankers. Goodness knows, the convoluted language US Federal Reserve chairmen have used over my career has been a constant source of hilarity. And now even the European Central Bank (ECB) is getting in on the act.
Here is a recent utterance of one Peter Praet (no, that is not a mis-spelling) the ECB chief economist, who responded to the question of what would happen if there was a sudden economic downturn: "If further adverse shocks were to materialise, our measures could be recalibrated once more, commensurate with the strength of the headwind, also taking into account possible side-effects".
Huh? I must put that one up for "Gobbledegook Quote of the Week". He must be paid by the word, that man.
MoneyWeek
Subscribe to MoneyWeek today and get your first six magazine issues absolutely FREE

Sign up to Money Morning
Don't miss the latest investment and personal finances news, market analysis, plus money-saving tips with our free twice-daily newsletter
Don't miss the latest investment and personal finances news, market analysis, plus money-saving tips with our free twice-daily newsletter
Meanwhile back in the real world, today I will veer a little off-piste to show that my tramline methods can work with large-cap individual shares. Many readers will be investors in stocks and you can use my methods to better time your purchases and sales.
I will analyse Prudential (insurance company) to show how I go through the process of identifying good entry and exit points. Note that I only look at large-cap shares, because sudden shocks, such as the sudden departure of the chief financial officer or the loss of a very large contract, would produce huge opening losses (or gains) in small caps. That could easily destroy any good work you had done.
This is less of a consideration in the large caps.
Here is Prudential a FTSE 100 component weekly chart showing the rally off the 2009 lows:
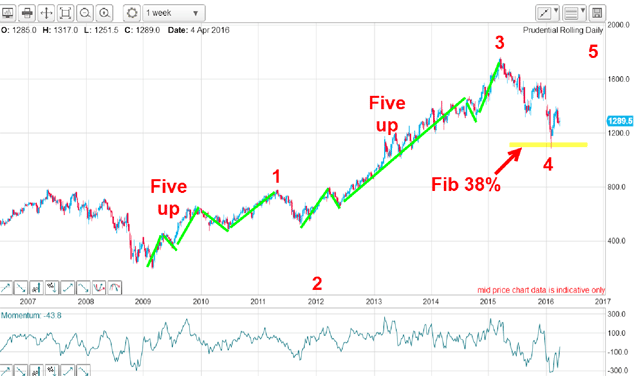
The waves line up best with these labels. My wave 1 contains a good five up, indicating that the major trend is up. This is one of the best tests to determine the main trend off a reversal, which occurred in early 2009 following massive declines in the credit crunch.
From the wave 2 low, the market entered a long and strong wave 3 to the early 2015 high. This third wave also contains its own very good five up. The high was made in an accelerated five wave rally:
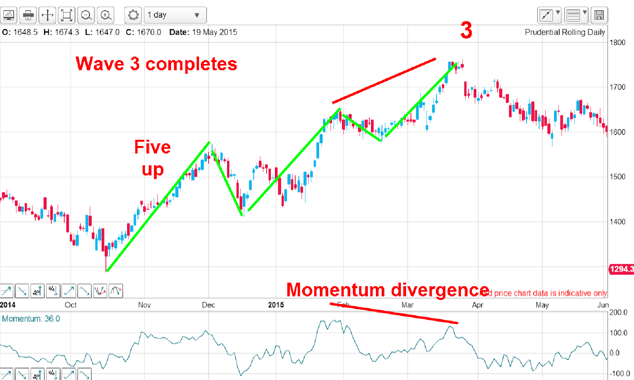
The final leg is a five up and the warning that the end was nigh was given when the momentum divergence appeared at the final fifth wave. That is a crucial signal I always look for when the market is in the final fifth wave. That prepares me to exit positions and even to look to reverse my stance.
From the wave 3 high, the market then embarked on a corrective phase, which I hoped was to be a three-wave A-B-C affair, as laid out in the Elliott wave rules. And that is what the market provided:
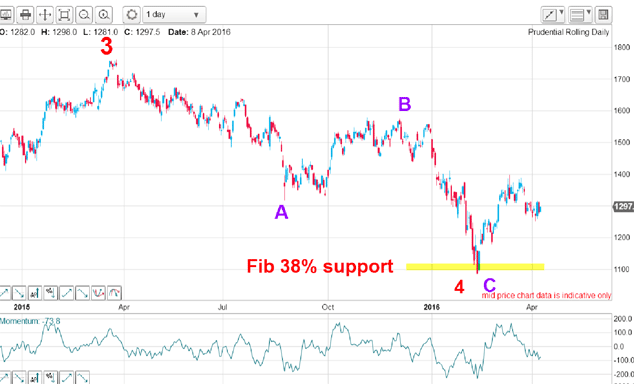
And the B wave high carried to the precise Fibonacci 38% retrace of the A wave, which is the same level that wave C of 4 terminated (see also top chart). It seems the 38% level is an important one for this share.
That wave C of 4 was put in on 11 February and the market has been in rally mode since. So that low was an ideal spot to buy (and cover any shorts taken near the wave 3 high).
If the bull run has started, I am looking for a five up in the final red wave 5. Has red wave 5 up started?
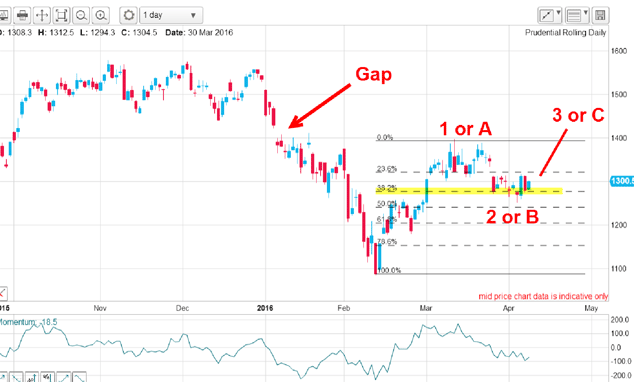
The rally to mid-March is either wave 1 of a five up or wave A of an A-B-C. And the dip to wave 2 or B carried to the Fibonacci 38% level. That makes three separate 39% retraces. I did say that level was an important one.
The path of least resistance seems to be up and directly ahead there is a large gap. Remember, gaps to tend to be filled (eventually) and this one is my immediate target.
The other point about gaps is that once filled, the market usually recoils back the way it came and that is what I expect here. That will be a supreme test of my wave 5 up idea.
But now, a long position taken near the wave C of 4 low can be protected by moving the protective stop to the entry point. That is a good place because if the market does decline to it, it would immediately cancel out my wave 5 idea and the market would likely decline below the previous wave 4 low.
And that would indicate the market was continuing its bear trend down to perhaps the next Fibonacci level (50%) around the 970 area.
In summary, I had a logical place in March last year to take profits in the £17-18 area and even position short. Then in February of this year, I had a good place to buy or take profits on shorts in the £11-12 area, as well as a long entry.
Get the latest financial news, insights and expert analysis from our award-winning MoneyWeek team, to help you understand what really matters when it comes to your finances.
John is is a British-born lapsed PhD physicist, who previously worked for Nasa on the Mars exploration team. He is a former commodity trading advisor with the US Commodities Futures Trading Commission, and worked in a boutique futures house in California in the 1980s.
He was a partner in one of the first futures newsletter advisory services, based in Washington DC, specialising in pork bellies and currencies. John is primarily a chart-reading trader, having cut his trading teeth in the days before PCs.
As well as his work in the financial world, he has launched, run and sold several 'real' businesses producing 'real' products.
-
 Average UK house price reaches £300,000 for first time, Halifax says
While the average house price has topped £300k, regional disparities still remain, Halifax finds.
-
 Barings Emerging Europe trust bounces back from Russia woes
Barings Emerging Europe trust has added the Middle East and Africa to its mandate, delivering a strong recovery, says Max King
-
 The challenge with currency hedging
A weaker dollar will make currency hedges more appealing, but volatile rates may complicate the results
-
 It's time to back the yen, says Dominic Frisby
The Japanese yen has been weak for a long time, says Dominic Frisby. That may soon change.
-
 Investors dash into the US dollar
News The value of the US dollar has soared as investors pile in. The euro has hit parity, while the Japanese yen and the Swedish krona have fared even worse.
-
 Why a strong dollar hurts – and what you can do about it
Analysis The US dollar is at its strongest level in 20 years. That’s bad news for most investment assets, says John Stepek – here’s why
-
 Could a stronger euro bring relief to global markets?
Analysis The European Central Bank is set to end its negative interest rate policy. That should bring some relief to markets, says John Stepek. Here’s why.
-
 HubSpot: a tech stock set to tumble
Tips US tech stocks have had a fantastic couple of years. But this year is unlikely to be so bullish for high-fliers that can’t turn big profits.
-
 What does the future hold for central bank digital currencies?
Briefings Many of the world's central banks – including the Bank of England – have expressed an interest in creating their own digital currencies. Shivani Khandekar looks at the state of play in central bank digital currencies.
-
 A weakening US dollar is good news for markets – but will it continue?
Opinion The US dollar – the most important currency in the world – is on the slide. And that's good news for the stockmarket rally. John Stepek looks at what could derail things.