Using my 'scalded cat bounce' pattern for low-risk trades
All good traders look for high-probability/low-risk trades. That way, you can have more losers than winners, yet still be ahead of the game. John C Burford explains how the 'scalded cat bounce' idea, can help you come as close as is possible to that ideal.
Get the latest financial news, insights and expert analysis from our award-winning MoneyWeek team, to help you understand what really matters when it comes to your finances.
You are now subscribed
Your newsletter sign-up was successful
Want to add more newsletters?

Twice daily
MoneyWeek
Get the latest financial news, insights and expert analysis from our award-winning MoneyWeek team, to help you understand what really matters when it comes to your finances.

Four times a week
Look After My Bills
Sign up to our free money-saving newsletter, filled with the latest news and expert advice to help you find the best tips and deals for managing your bills. Start saving today!
All good traders are looking for high-probability/low-risk trades. That way, you can have many more losers than winners, yet still be ahead of the game. It's the ultimate way to follow at least the first part of the age-old advice: "Cut your losses short and let your profits run".
As most traders who've tried it will know, this is easier said than done. But I have found that by using my 'scalded cat bounce' (SCB) idea, I can come as close as is possible to doing just that. But what is an SCB?
Let me explain. When a long-standing trendline (or tramline) is finally broken, the market very often reverses right back to meet the line. If the break signals a genuine trend change, the market will then bounce off the line very smartly and proceed in the new direction rapidly. In other words, the market runs just as a cat would if scalded quite fast!
MoneyWeek
Subscribe to MoneyWeek today and get your first six magazine issues absolutely FREE

Sign up to Money Morning
Don't miss the latest investment and personal finances news, market analysis, plus money-saving tips with our free twice-daily newsletter
Don't miss the latest investment and personal finances news, market analysis, plus money-saving tips with our free twice-daily newsletter
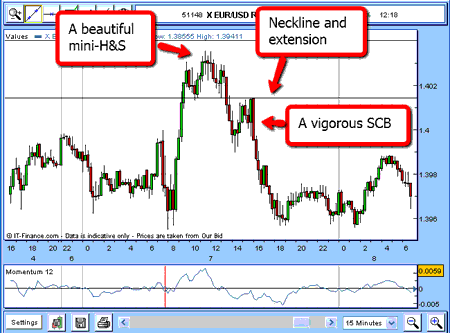
I have a great example here in recent trading in the EUR/USD:

(Click on the chart for a larger version)
From previous posts, you recall I was expecting a top in the euro at around the $1.40 area for several reasons. To recap:
1. The $1.40 area is an approximate Fibonacci retrace of the previous wave down from $1.4280 in November 2010 to the January 2011 $1.2870 low.
2. The move up from the January low is an A-B-C pattern, which is counter-trend, meaning the larger trend is still down, so I wish to trade from the short side.
3. At the 7 March high of $1.4040, the measure of wave C is an exact 61.8% Fibonacci retrace of wave A a very common relationship within A-B-C waves.
4. There was a huge negative divergence with momentum at wave C compared with the value at wave A.
5. Bullish sentiment on the euro was at or near records at wave C.
These five points were giving me absolutely no excuse not to short the euro into the big rally. The set-up was text-book stuff.
The mini-head and shoulders (H&S) pattern (you can read more about head and shoulders patterns in one of my previous posts) right at the top was a huge signal to me that I could now look for a short trade. As the market was falling through the neckline, that was the place to enter the trade, using the high as guide for an initial protective stop.
Markets often 'kiss' the line, then break away in a SCB
The market did move lower, but then rallied right back to the underside of the line. That was another place which offered a great shorting opportunity. Of course, if I wait for this rebound before doing the trade, I do run the risk of missing it if the market simply keeps falling without rebounding first.

Claim your FREE report: The 6-step game-plan for
spread betting profits
But look at the action after it rebounded off the line the down bars (in red) are much longer than the up bars (in green) on this 15-minute chart.
The next question is: Where to take profits? But I will leave that for another time, as I am focusing on trade entries here.
A similar SCB in gold
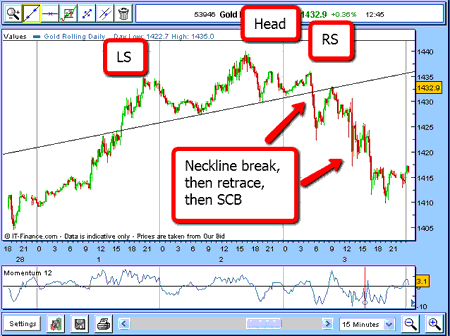
Here is another example (in gold). On 2 March, the market made an H&S top pattern, after a good rally. Then came the neckline break, a retrace to kiss the underside of the line, and then an SCB:

(Click on the chart for a larger version)
Note that in both examples, the retrace back to the line was exact to within a few pips. That means you can enter quite precise price limits in your orders. That is a very valuable advantage.
Also, you can set very close protective stops, as an SCB failure would mean the market would just keep the retrace move going and the protective stop would be hit for a small loss. Failures of this kind do happen.
In both trades, a safe stop would be 20-30 pips, with a potential gain of 200+ pips in the gold, and 100+ pips in the euro. It is well worth searching for these mini-H&S patterns in all time-frames and using the SCB effect to enter low risk/high reward trades.
Get the latest financial news, insights and expert analysis from our award-winning MoneyWeek team, to help you understand what really matters when it comes to your finances.
John is is a British-born lapsed PhD physicist, who previously worked for Nasa on the Mars exploration team. He is a former commodity trading advisor with the US Commodities Futures Trading Commission, and worked in a boutique futures house in California in the 1980s.
He was a partner in one of the first futures newsletter advisory services, based in Washington DC, specialising in pork bellies and currencies. John is primarily a chart-reading trader, having cut his trading teeth in the days before PCs.
As well as his work in the financial world, he has launched, run and sold several 'real' businesses producing 'real' products.
-
 Average UK house price reaches £300,000 for first time, Halifax says
While the average house price has topped £300k, regional disparities still remain, Halifax finds.
-
 Barings Emerging Europe trust bounces back from Russia woes
Barings Emerging Europe trust has added the Middle East and Africa to its mandate, delivering a strong recovery, says Max King