Timing a gold trade using a 'head and shoulders' pattern
Tramline trading is sometimes not enough to identify entry and exit points. But when combined with 'head and shoulders' patterns it can become easier to time a trade. Here's an example from the gold market.
Get the latest financial news, insights and expert analysis from our award-winning MoneyWeek team, to help you understand what really matters when it comes to your finances.
You are now subscribed
Your newsletter sign-up was successful
Want to add more newsletters?

Twice daily
MoneyWeek
Get the latest financial news, insights and expert analysis from our award-winning MoneyWeek team, to help you understand what really matters when it comes to your finances.

Four times a week
Look After My Bills
Sign up to our free money-saving newsletter, filled with the latest news and expert advice to help you find the best tips and deals for managing your bills. Start saving today!
In my last post, I wrestled with the Elliott wave counts in gold and was caught out with an incorrect count. I was attempting to identify a top using my tramline trading method and Elliott wave theory. My short trade produced a loss as the market failed to move away from my tramline I had carefully identified. I call this a tramline failure.
Many traders would find that a frustrating experience and either give up trying to short gold, or reverse their stance and go long. I have found that whenever I did reverse positions (in my early trading days), I am whipsawed to death, as more often than not the market then goes in my original direction!Thankfully, I am tempted to do this only a few times a year, but painful experience has taught me to go and lie in a dark room until the feeling goes away.
Incidentally, spread-betting/trading involves fighting your own demons with your money at stake. There is no easy way to overcome your bad habits, as I know only too well. But it is well worth the effort to learn to discover and then accept what they are and to find ways to overcome them. I find that developing a more patient approach works for me. In the meantime, using my 3% rule and break-even rule keeps you out of serious trouble if you have strayed from the straight and narrow.
MoneyWeek
Subscribe to MoneyWeek today and get your first six magazine issues absolutely FREE

Sign up to Money Morning
Don't miss the latest investment and personal finances news, market analysis, plus money-saving tips with our free twice-daily newsletter
Don't miss the latest investment and personal finances news, market analysis, plus money-saving tips with our free twice-daily newsletter
The difficulty in finding a top
Back to the trade: I still had faith that my new revised Elliott wave count was the likely one and that I could still make a profit from short sales, provided I could identify a top. This post is a follow-up where I identify the likely counts on a short time-frame. Subsequent to the trading at the end of my previous post, the pattern became much clearer and a short sale was indeed profitable. Here is how it happened.

Claim your FREE report: The 6-step game-plan for
spread betting profits
Recall that I was forced to re-label the late 2010 tops as wave 3, the January $1,300 low as wave 4, and trading since has been wave 5 a finishing wave. I must therefore look for a top above the late 2010 tops. Then, on 2 March, the market rallied to $1,440 a new high. According to Elliott wave theory, this was enough for a top to be genuine.
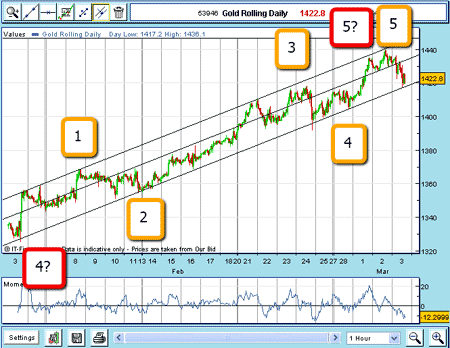
However, we often see extended fifth waves which go on and on and on. I needed to get inside the structure of this wave 5 to give me clues as to the likely direction. Here is the latest hourly chart going back to my revised wave 4 £1,300 low:

(Click on the chart for a larger version)
Note that wave 4 was made in January at $1,307 (off the chart). I have drawn my likely count in yellow for the internal five waves up within the larger red wave 5, complete with a negative divergence with momentum at $1,440. The two outer lines are my tramlines enclosing all trading from the low, except for a few 'overshoots', which is normal.
A great example of a 'head and shoulders' pattern
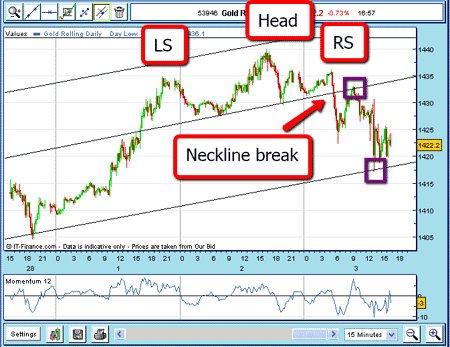
Now let's get inside this early March 'topping' area to see if there are any clues:

(Click on the chart for a larger version)
This is a 15-minute chart showing a very pretty mini-head and shoulders (H&S) pattern with the left shoulder (LS) and right shoulder (RS) lying beneath the head. I have drawn the neckline, which connects the lows between the shoulders and the head. If this is a genuine reversal pattern, a break of the neckline should be a good candidate for a short sale using a sell-stop order.
The market did break below, and then rallied right to the underside of the neckline extension, as is normal (market in purple box). It then moved back down in what I call a 'scalded cat bounce', thus confirming the highly resistive nature of my neckline. The market evidently doesn't want to trade back above it, and the short-term (at least) trend is now down.
The market then made a lunge at my lower tramline (marked by the purple boxes). This is where short-term traders could be taking profits for a quick 140 pip gain, if shorting at the neckline. That is a profit of £140 on a £1 down bet.
That is a great example of using H&S patterns to enter and using my tramlines to take profits.
A longer-term trader would be holding short positions looking for a bigger fall, anticipating a break of the lower tramline. By using my break-even rule, protective stops could be moved as the market hit the lower tramline.
I shall be following this trade closely as it develops. Hopefully, I will post as closely as possible to real time trading, as the gold market is one of the most popular for spread betters.
NB: Don't miss my next bit of trading advice. To receive all my spread betting blog posts by email, as soon as I've written them, just sign up here .
Get the latest financial news, insights and expert analysis from our award-winning MoneyWeek team, to help you understand what really matters when it comes to your finances.
John is is a British-born lapsed PhD physicist, who previously worked for Nasa on the Mars exploration team. He is a former commodity trading advisor with the US Commodities Futures Trading Commission, and worked in a boutique futures house in California in the 1980s.
He was a partner in one of the first futures newsletter advisory services, based in Washington DC, specialising in pork bellies and currencies. John is primarily a chart-reading trader, having cut his trading teeth in the days before PCs.
As well as his work in the financial world, he has launched, run and sold several 'real' businesses producing 'real' products.
-
 Can mining stocks deliver golden gains?
With gold and silver prices having outperformed the stock markets last year, mining stocks can be an effective, if volatile, means of gaining exposure
-
 8 ways the ‘sandwich generation’ can protect wealth
People squeezed between caring for ageing parents and adult children or younger grandchildren – known as the ‘sandwich generation’ – are at risk of neglecting their own financial planning. Here’s how to protect yourself and your loved ones’ wealth.