Elliott wave theory in practice - you're not always right first time
Elliott wave theory gives you a firm idea of where the market should be headed - but only if it conforms to your wave count. In this example from the gold market, the initial count was wrong, but the Elliott wave principals served to minimise the losses.
Get the latest financial news, insights and expert analysis from our award-winning MoneyWeek team, to help you understand what really matters when it comes to your finances.
You are now subscribed
Your newsletter sign-up was successful
Want to add more newsletters?

Twice daily
MoneyWeek
Get the latest financial news, insights and expert analysis from our award-winning MoneyWeek team, to help you understand what really matters when it comes to your finances.

Four times a week
Look After My Bills
Sign up to our free money-saving newsletter, filled with the latest news and expert advice to help you find the best tips and deals for managing your bills. Start saving today!
The gold market has been one of the best bull markets for many years. It was once the preserve of professional investors, but the introduction of ETFs (exchange-traded funds) and other instruments has meant that small investors can now trade gold bullion with relatively small investments.
Gold coins continue to be very popular, but most people who buy them hang on to them for dear life, appreciating their beauty as much as their investment value. I would say that most are taken out of circulation for many years. Also, the dealer bid/ask spread makes them unsuitable for traders.
In the old days when only the futures market at Comex offered speculators a means of betting on the future price of gold, it was quite complicated setting up a futures account, and the margins were high.
MoneyWeek
Subscribe to MoneyWeek today and get your first six magazine issues absolutely FREE

Sign up to Money Morning
Don't miss the latest investment and personal finances news, market analysis, plus money-saving tips with our free twice-daily newsletter
Don't miss the latest investment and personal finances news, market analysis, plus money-saving tips with our free twice-daily newsletter
But with the advent of spread betting, traders of all sizes can now bet on gold. So public participation has grown hugely, and the bull story (mainly the debasing of the US dollar through quantitative easing, or QE) has been widely taken up by the public (not to mention the professionals).
A valuable lesson in using Elliott wave principles
As a mainly contrarian trader, I like to spot changes in trend, which usually come after extremes of sentiment. Gold has been pushing the boundaries of bullishness for months now, so I am looking for a change in trend from up to down.
To help me, I use Elliott wave (EW) principles to see where the market lies in the wave patterns. Gold has given me a great working example of the use of EW to share with you recent patterns have been difficult to interpret and I have needed to change my tune.
Incidentally, EW theory gives you a firm idea of where the market should be headed, if it is conforming to your EW count. The following example shows that my initial count was wrong. However, the evidence was provided very swiftly, and only a small loss was taken.

(Click on the chart for a larger version)
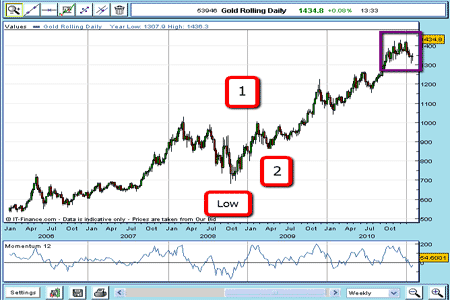
Here is the multi-year weekly gold chart. It shows the big bull market interrupted by the large $300+ correction in 2008. If we count the $680 low as our low to start the EW count, as seems reasonable, I would like to see five clear waves before calling a top. So that was my plan in late 2010.
I have marked waves one and two, and wave three should be complex, strong and impulsive. My candidate for the wave the high was the $1,424 high in November. At that point, momentum was practically off the scale.

Claim your FREE report: The 6-step game-plan for
spread betting profits
The market backed off, then rallied to a new high in December of $1,430. That was enough for EW principles, especially because the December high occurred on a lower momentum reading (on the daily chart) than at the November high.
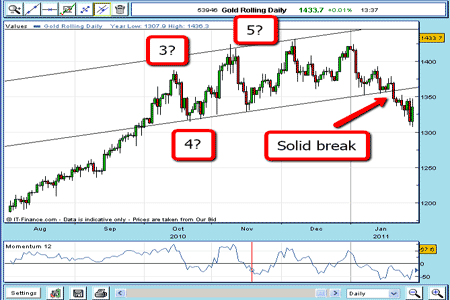
I believed I had my five Elliott waves complete and could look forward to a severe drop to well under $1,000 on this move. Here is what it looked like at the time (I have blown up the area indicated highlighted in the purple box in the chart above):

(Click on the chart for a larger version)
I have drawn reliable-looking tramlines containing the very 'toppy'-looking trading from October to January. Then, to get me excited, the market broke decisively through my lower tramline in January, where I had placed a sell order to go short.
Naturally, I also placed a protective stop just inside the tramline in case the market unexpectedly rallied back inside the tramlines using my 3% rule.
What to do when your EW count is wrong change tack
For several days, the market continued to fall, and I was getting more confident that I had found the top. The market then made a normal rally back to the underside of the tramline on 20 January, tried to bounce off in one of my 'scalded cat bounces' (where it touches the tramline then shies away), but instead of falling fast, as 'should' have occurred, the market just turned back up and traded back inside my tramlines, and my stop was hit for a loss.
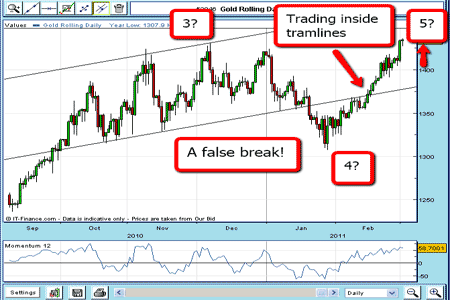
I quickly realised that the market was not respecting my EW analysis! Obviously, my EW count was wrong, and the more probable count was this:

(Click on the chart for a larger version)
...where the late February rally is a wave five, and the final top had not been reached. If this is correct, this fifth wave will end at some stage, and I will attempt once again to identify the turning point.
By using the tramline method in conjunction with EW methods, I managed to be wrong, but take only a small loss. The clue that I was wrong was the rapid rally back inside my tramlines. My tramline method gives me almost precise entry points, and exit points in case my analysis is wrong. This is all you can ask for in a trading method.
Most traders/spread betters will take many losses like this. My trade was actually an excellent one and I was happy with it, despite the loss. I followed all my rules, but the market just didn't co-operate. That's life!
NB: Don't miss my next bit of trading advice. To receive all my spread betting blog posts by email, as soon as I've written them, just sign up here .
Get the latest financial news, insights and expert analysis from our award-winning MoneyWeek team, to help you understand what really matters when it comes to your finances.
John is is a British-born lapsed PhD physicist, who previously worked for Nasa on the Mars exploration team. He is a former commodity trading advisor with the US Commodities Futures Trading Commission, and worked in a boutique futures house in California in the 1980s.
He was a partner in one of the first futures newsletter advisory services, based in Washington DC, specialising in pork bellies and currencies. John is primarily a chart-reading trader, having cut his trading teeth in the days before PCs.
As well as his work in the financial world, he has launched, run and sold several 'real' businesses producing 'real' products.
-
 Average UK house price reaches £300,000 for first time, Halifax says
While the average house price has topped £300k, regional disparities still remain, Halifax finds.
-
 Barings Emerging Europe trust bounces back from Russia woes
Barings Emerging Europe trust has added the Middle East and Africa to its mandate, delivering a strong recovery, says Max King