This tramline break could start a big decline in the Dow
We could be in an historic period for the Dow, says John C Burford. And it’s just possible we've seen the market's high.
Get the latest financial news, insights and expert analysis from our award-winning MoneyWeek team, to help you understand what really matters when it comes to your finances.
You are now subscribed
Your newsletter sign-up was successful
Want to add more newsletters?

Twice daily
MoneyWeek
Get the latest financial news, insights and expert analysis from our award-winning MoneyWeek team, to help you understand what really matters when it comes to your finances.

Four times a week
Look After My Bills
Sign up to our free money-saving newsletter, filled with the latest news and expert advice to help you find the best tips and deals for managing your bills. Start saving today!
Over the Bank Holiday weekend, markets have been stirring!
I now believe we could well be in a historic period for the Dow and other markets I follow. I hope to get to gold soon so do stand by for that.
But today, let's focus on the Dow.
MoneyWeek
Subscribe to MoneyWeek today and get your first six magazine issues absolutely FREE

Sign up to Money Morning
Don't miss the latest investment and personal finances news, market analysis, plus money-saving tips with our free twice-daily newsletter
Don't miss the latest investment and personal finances news, market analysis, plus money-saving tips with our free twice-daily newsletter
In my 2 May email, I noted the Dow had on the previous day made a new rally high above the March 13,300 highs. That got me very excited for several reasons.
It's possible we've just seen the high on the Dow
First, the Dow had the potential to complete the large five-wave Elliott wave pattern up from the December lows (see 2 May email for chart showing my count).
According to Elliott wave theory, in a completed five-wave pattern, the fifth wave is an ending wave, and we can expect at least a correction to the trend.
If my count was correct, the 13,338 1 May high held the potential to be the big rally high. For confirmation, I need to see tramlines and wedge lines broken to the downside and a new small-scale five-wave pattern down.
And that's what we've got
As I write this morning, I can see breaks of lines and the near-completion of a small-scale five-wave pattern down.
I am very close to confirming the 13,338 1 May point as the high.
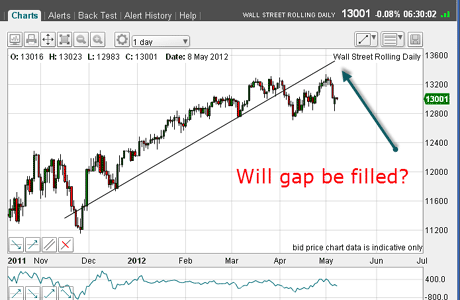
Take a look at this daily chart of the Dow:
(Click on the chart for a larger version)
Here is the original trendline which was broken in early April. The April rally to the 1 May high has fallen short of the underside of this line.
This is significant, as it demonstrates weakness the bull market was running out of steam.
Risk is being taken off the table the next bearish sign
The second reason I was excited was the fact that no other major stock index followed the Dow into new high ground.
In particular, the S&P 500, which I consider a slightly more risk-on' index, fell way short of a new high.
This indicated to me that the Dow the Steady Eddie of the indexes was all exposed. To maintain belief in the rally, the other indexes needed to make new highs.
This non-confirmation of the new Dow high is an indication that risk is being taken off the table investors are becoming more cautious. This is bearish, of course.
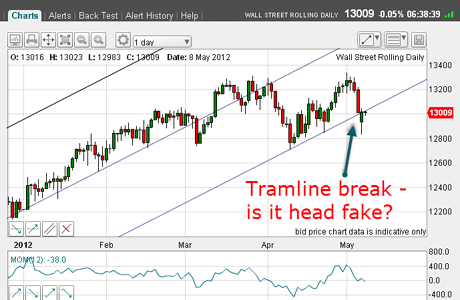
Last time, I showed new tramlines on the daily chart. Since then, the market has moved out of no-man's-land and broken the lower tramline:
(Click on the chart for a larger version)
Following European election results, the market opened sharply lower yesterday, but recovered to close about unchanged.
We have a tramline break, but the pull-back poses a question: Is this a head-fake, or is it a normal pull-back to the underside of the tramline in a kiss prior to a scalded cat bounce?
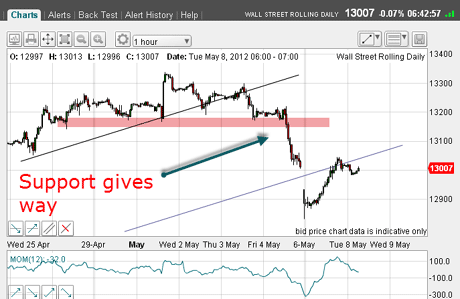
To find more clues, I like to go to the hourly chart:
(Click on the chart for a larger version)
The tramline break last Thursday was the initial signal for a larger decline.
And when chart support (pink bar) gave way, it would have been an excellent area to enter short trades. Protective stops, following my 3% rule, could then have been placed just above the 13,100 level.
Monday's gap opening was closed by the end of trading, and the underside of the tramline has been hit. This was an excellent place to suspect Monday's rally was ending.
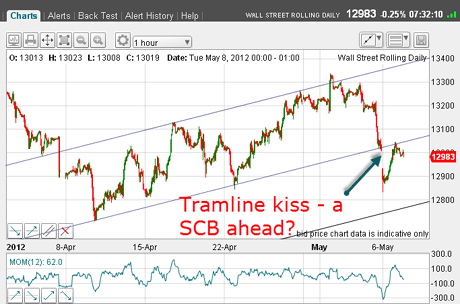
But let's have a look at the updated chart of the hourly tramlines:
(Click on the chart for a larger version)
Last time, the market was trading between the two upper tramlines, and on Monday, there was a break and pull-back for the kiss. Will we see a scalded cat bounce down now?
Incidentally, Monday's tramline break helped confirm my A-B-C labelling for the April rally leg. A-B-Cs are always counter-trend (down).
It's all adding up the market wants to decline
I mentioned that I have spotted a five-wave pattern forming.
To see it, let's now go to the 15-minute chart:
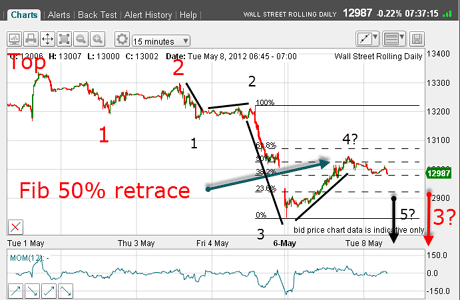
(Click on the chart for a larger version)
And here are my Elliott wave counts. From the 13,338 1 May top, I can count two sets of waves. We are currently in the third wave of the larger red set. Remember, third waves are usually long and strong' and this one is qualifying with Monday's plunge on weak momentum.
But within the red third wave, I can count a smaller set (black labels). If my count is correct, we are finishing off wave 4 (black) having hit a Fibonacci 50% retrace of wave 3.
My chart points to a large decline directly ahead
The implications are clear: A large decline in a wave 3 (red) and wave 5 (black) could lie directly ahead. That is my roadmap.
The chart predicts a decline to the lower tramline on the hourly chart above in the 12,800 area. The 10 April 12,700 low also beckons. Breaking that would spell big trouble for the bulls.
Of course, there are no guarantees in the markets, and if the market can pick itself up from here and continue its rally, that would cancel out my labels, as something else would be going on. It would be back to the drawing board for me.
Trading tip: This illustrates one of the great benefits of Elliott wave analysis. It can give a definite forecast for price action ahead. Failure of the market to meet the forecast means that the analysis is wrong and it could be best to exit the market until the fog clears. But when the markets follow your script, that is satisfying and exciting!
This morning, I believe the odds favour a scenario for lower prices. And remember exactly a year ago, the Dow made a major rally high on the first trading day in May (as this year) and then promptly declined by 1,000 points over the next few weeks.
Will history repeat and confirm the rule to 'Sell in May and go away'? We'll see. I'd love to know what you think. Let me know your thoughts.
If you're a new reader, or need a reminder about some of the methods I refer to in my trades, then do have a look at my introductory videos:
The essentials of tramline trading
An introduction to Elliott wave theory
Advanced trading with Elliott waves
Don't miss my next trading insight. To receive all my spread betting blog posts by email, as soon as I've written them, just sign up here .
Get the latest financial news, insights and expert analysis from our award-winning MoneyWeek team, to help you understand what really matters when it comes to your finances.
John is is a British-born lapsed PhD physicist, who previously worked for Nasa on the Mars exploration team. He is a former commodity trading advisor with the US Commodities Futures Trading Commission, and worked in a boutique futures house in California in the 1980s.
He was a partner in one of the first futures newsletter advisory services, based in Washington DC, specialising in pork bellies and currencies. John is primarily a chart-reading trader, having cut his trading teeth in the days before PCs.
As well as his work in the financial world, he has launched, run and sold several 'real' businesses producing 'real' products.
-
 Can mining stocks deliver golden gains?
With gold and silver prices having outperformed the stock markets last year, mining stocks can be an effective, if volatile, means of gaining exposure
-
 8 ways the ‘sandwich generation’ can protect wealth
People squeezed between caring for ageing parents and adult children or younger grandchildren – known as the ‘sandwich generation’ – are at risk of neglecting their own financial planning. Here’s how to protect yourself and your loved ones’ wealth.
-
 DR Horton: US housebuilder that's piling up profits
Tips US housebuilder DR Horton’s stock rests on firm foundations and looks cheap. Matthew Partridge looks at the best way to play it.
-
 DoorDash won't deliver for investors. Here's how to short it
Tips American food-delivery app DoorDash can’t even make money in a pandemic. Matthew Partridge explains the best way to short it.
-
 Trading: it’s time for investors to dump Match.com
Tips The dating group is grappling with regulators and looks absurdly expensive.
-
 Build profits with this industrial equipment rentals company
Tips United Rentals is poised to benefit from higher spending on infrastructure. Matthew Partridge explains the best way to play it.
-
 Stocks surge in massive short squeeze
Features Speculators are dumping their short bets in droves, says John C Burford. That spells opportunity in the charts for swing traders.
-
 Is Google parent company Alphabet in the soup?
Features Investors in tech giants such as Alphabet were happy to drive up the valuations, says John C Burford. But now patience has run out.
-
 Which stockmarket is down 99.986% since 2007?
Features One European stockmarket has lost virtually all its value since the financial crisis. We'll see more of the same before the current crash is out, says John C Burford.
-
 Bad news isn’t good news for stocks anymore
Features Last year, the mantra was “bad news is good for stocks”. Now, it looks like traders have finally switched their thinking around, says John C Burford.