Which stockmarket is down 99.986% since 2007?
One European stockmarket has lost virtually all its value since the financial crisis. We'll see more of the same before the current crash is out, says John C Burford.
Get the latest financial news, insights and expert analysis from our award-winning MoneyWeek team, to help you understand what really matters when it comes to your finances.
You are now subscribed
Your newsletter sign-up was successful
Want to add more newsletters?

Twice daily
MoneyWeek
Get the latest financial news, insights and expert analysis from our award-winning MoneyWeek team, to help you understand what really matters when it comes to your finances.

Four times a week
Look After My Bills
Sign up to our free money-saving newsletter, filled with the latest news and expert advice to help you find the best tips and deals for managing your bills. Start saving today!
In the first four trading days of the year, global stockmarkets have been hammered. The Chinese authorities have shut down the stockmarket twice this week after they pumped in untold billions in "support". I guess even China cannot print yuan fast enough to staunch the emerging collapse.
But China is only doing what all central banks around the world have been doing for years trying to manipulate the markets. Their magical powers over them seem now to be on the slide.
Many are saying the Shanghai exchange is a casino that has little bearing on the "real" economy. Perhaps it is, but the crucial point is that a market in freefall indicates that social mood is turning more bearish. Fear is stalking the people. And fearful people normally do not grow an economy they conserve resources.
MoneyWeek
Subscribe to MoneyWeek today and get your first six magazine issues absolutely FREE

Sign up to Money Morning
Don't miss the latest investment and personal finances news, market analysis, plus money-saving tips with our free twice-daily newsletter
Don't miss the latest investment and personal finances news, market analysis, plus money-saving tips with our free twice-daily newsletter
As I wrote on Wednesday, money managers have had an historic change of heart. Before the holidays, markets were in the throes of a small Santa rally. Many pundits were forecasting a benign stockmarket environment in 2016, with the US and world economy showing growth despite the pledged US Federal Reserve interest rate hikes.
Many are ascribing these sharp declines in virtually all stock indexes directly to the turmoil in Shanghai. But there is a major problem with this theory, and that is that companies in the S&P 500 derive only 2% of revenues directly from China hardly a decisive impact on their earnings. So how come the headlines proclaimed it was the China syndrome? Answer: because it was the "obvious" reason (and the obvious is often plain wrong).
Those that believe it is data and fundamentals that drive the markets had better think again.
Perhaps they would do better by studying market sentiment instead (although they never will, thankfully for us). One reliable measure of sentiment is my old friend the DSI (Daily Sentiment Index) that daily tracks the sentiment of US professional money managers towards various markets. I have used this index many times over the years and find it is a good reflection of social mood the ultimate force that drives all freely traded markets.
Here is the latest chart of DSI plotted against the S&P 500 daily closes:
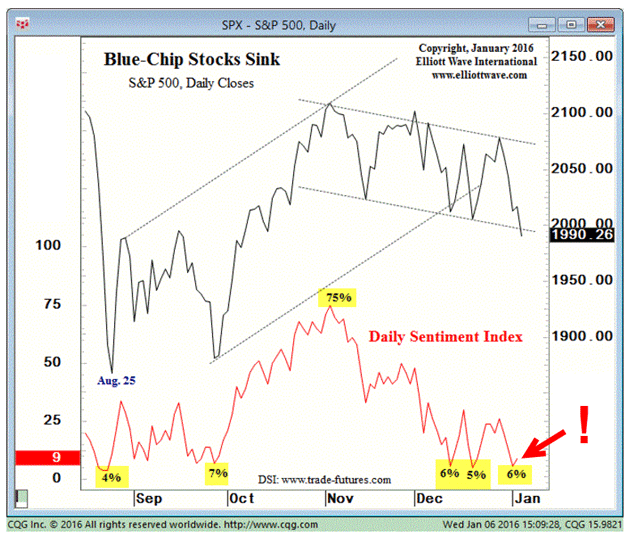
This picture speaks a thousand words. At market tops, bullish sentiment is very high, while at lows, bullish sentiment is very low. That is much of what you need to know about how markets work! You may be feeling very bullish or bearish, but it is the aggregate mood of the herd that is important and that information can help you forecast the next market move.
Today, DSI is running at low levels from where previous rallies have started. And that is why I expected a rally starting yesterday (or last night). The Dow has the potential to approach the 17,000 area from here (currently 16,650).
But there is one major point about DSI bullish conviction can stay on the floor for a very long time during a market collapse. It should not be used as your major market timing tool! For that you need a complete trading method, such as my Tramline Method.
But with the Dow having hit my near-term target at the Fibonacci 50% of the wave up off the August low around the 16,500 level, I took partial profits near yesterday's low. I suspect a decent bounce could be in prospect to trapall the late shorts in a squeeze.
As long-time readers of mine know, I have been bearish on Japan shares for some time, while many others have been bullish (that's what makes a market!). The big difference is that I use chart patterns and sentiment, while most others tell a "story" (which can turn out to be a myth). Here is the Nikkei with my Elliot wave labels:
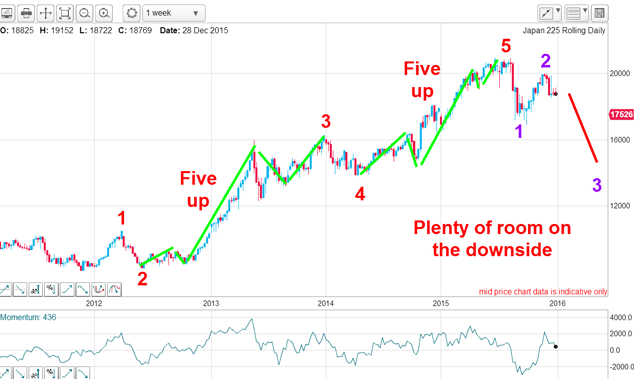
If correct, we are at the early stages of a wave 3 down that could take the market to the 14,500 area in 2016.
I can also draw a superb upper tramline:
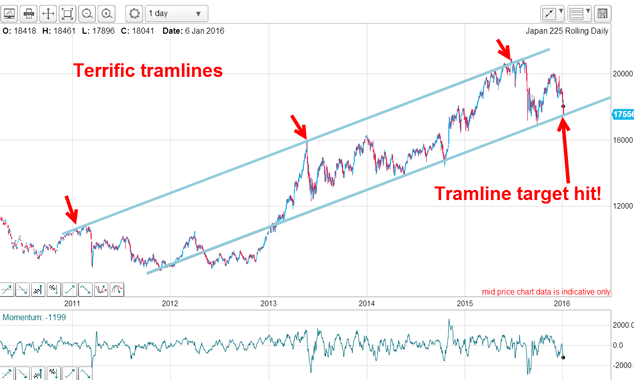
The three major tops since 2011 are very accurate touch points. This validates the line as a solid line of resistance. The parallel tramline below also reassuringly sports several accurate touch points and represents a solid line of support.
That tramline pair gave me my first downside target on the tramline in the 17,500 area. This was hit this week. Once this lower tramline is broken it will be hard down in wave 3. But first, a bounce is in prospect.
The only event that could alter this outlook is a move above my wave 2 high, which appears unlikely.
Another darling of the forecasters last year is the German DAX. Many pundits believed it would sustain its rally as the eurozone economy would pick up in 2016 and the euro would remain undervalued.
But a funny thing happened on the way to this forecast deflation began rearing its head and that trumped any pickup in EZ' activity. Actually, with sky-high unemployment and a debt time bomb ready to pop at any time, I was exceptionally sceptical of that rosy scenario.
Here is the daily DAX:
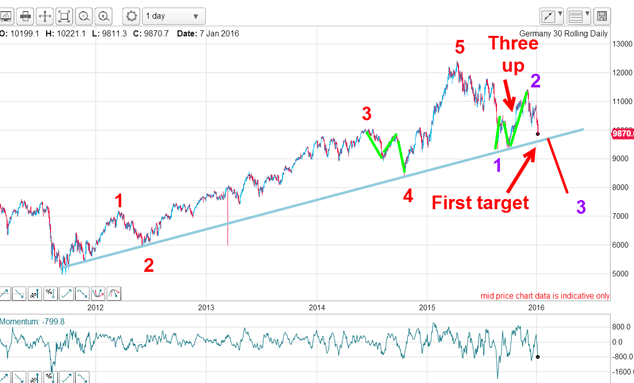
The high was made early last year and the decline was seen by many as a "buy the dip" opportunity. But if my Elliot wave labels are correct, the second half rally was an opportunity to unload. The market has almost made my first target on the blue trendline. Much lower potential exists.
And if you want something really scary to ponder, how about the tiny Cypriot stockmarket? Last year, Cyprus' citizens had to suffer two bail-ins to rescue the banks. Their debt/GDP ratio had ballooned (sound familiar?) and had hit the buffers.
So how much has the market lost so far? 10%? 20%? Or could it me a heart-stopping 50%? No, the loss has been 99.986%. Yes, believe it or not, here is the chart:
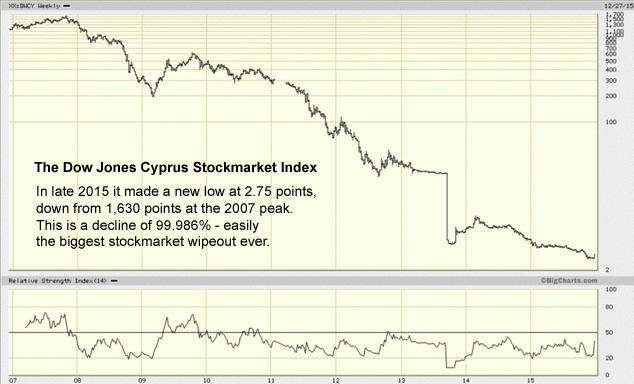
A €10,000 investment in 2007 would now be worth just €1.40. Ouch! How's that for a great buy and hold investment?
Naturally, if you were using my stop-loss methods, you would be out well before this, thus proving the illusion of the lazy set-and-forget styles of investing. It only works in bull markets where all boats are lifted.
I have a feeling we shall see many such stock charts with similar (although not so dramatic) patterns to this one before the crash is over.
Get the latest financial news, insights and expert analysis from our award-winning MoneyWeek team, to help you understand what really matters when it comes to your finances.
John is is a British-born lapsed PhD physicist, who previously worked for Nasa on the Mars exploration team. He is a former commodity trading advisor with the US Commodities Futures Trading Commission, and worked in a boutique futures house in California in the 1980s.
He was a partner in one of the first futures newsletter advisory services, based in Washington DC, specialising in pork bellies and currencies. John is primarily a chart-reading trader, having cut his trading teeth in the days before PCs.
As well as his work in the financial world, he has launched, run and sold several 'real' businesses producing 'real' products.
-
 Average UK house price reaches £300,000 for first time, Halifax says
While the average house price has topped £300k, regional disparities still remain, Halifax finds.
-
 Barings Emerging Europe trust bounces back from Russia woes
Barings Emerging Europe trust has added the Middle East and Africa to its mandate, delivering a strong recovery, says Max King
-
 DR Horton: US housebuilder that's piling up profits
Tips US housebuilder DR Horton’s stock rests on firm foundations and looks cheap. Matthew Partridge looks at the best way to play it.
-
 DoorDash won't deliver for investors. Here's how to short it
Tips American food-delivery app DoorDash can’t even make money in a pandemic. Matthew Partridge explains the best way to short it.
-
 Trading: it’s time for investors to dump Match.com
Tips The dating group is grappling with regulators and looks absurdly expensive.
-
 Build profits with this industrial equipment rentals company
Tips United Rentals is poised to benefit from higher spending on infrastructure. Matthew Partridge explains the best way to play it.
-
 Stocks surge in massive short squeeze
Features Speculators are dumping their short bets in droves, says John C Burford. That spells opportunity in the charts for swing traders.
-
 Is Google parent company Alphabet in the soup?
Features Investors in tech giants such as Alphabet were happy to drive up the valuations, says John C Burford. But now patience has run out.
-
 Bad news isn’t good news for stocks anymore
Features Last year, the mantra was “bad news is good for stocks”. Now, it looks like traders have finally switched their thinking around, says John C Burford.
-
Spread betting: A tax-free way to trade
Features Spread betting is Britain's favourite way of using borrowed money to play the stockmarket. And you don't have to pay on your profits. Here's how it works.