Bad news isn’t good news for stocks anymore
Last year, the mantra was “bad news is good for stocks”. Now, it looks like traders have finally switched their thinking around, says John C Burford.
Get the latest financial news, insights and expert analysis from our award-winning MoneyWeek team, to help you understand what really matters when it comes to your finances.
You are now subscribed
Your newsletter sign-up was successful
Want to add more newsletters?

Twice daily
MoneyWeek
Get the latest financial news, insights and expert analysis from our award-winning MoneyWeek team, to help you understand what really matters when it comes to your finances.

Four times a week
Look After My Bills
Sign up to our free money-saving newsletter, filled with the latest news and expert advice to help you find the best tips and deals for managing your bills. Start saving today!
Over the years, I have noted a curious phenomenon in the markets. Something strange often happens to the psychology of money managers over the end-of-year holiday period. Perhaps it is the enforced hiatus in trading that casts a spell over traders. Or perhaps they take their minds off the markets for long enough to come to their senses.
Last year, the mantra was this: "bad news is good for stocks". Yes, this crazy idea took hold over the herd and was justified only by the idea that a poor economy would encourage the US Federal Reserve to keep interest rates on the floor and even encourage them to introduce more quantitative easing (QE) if the economy tanked enough. Of course, this implies belief that the Fed possesses a supreme power over the economy. As I have been warning: this belief will be sorely tested when the market starts its bear trend.
But for several years, traders saw that this QE/zero interest-rate policy was responsible for sending the S&P 500 up from the depths of the 2009 low at the biblical 666 point to the 2015 high of 2,136, a gain of a staggering 220%. That much was obvious, surely and the Fed was seen as the Great Enabler.
MoneyWeek
Subscribe to MoneyWeek today and get your first six magazine issues absolutely FREE

Sign up to Money Morning
Don't miss the latest investment and personal finances news, market analysis, plus money-saving tips with our free twice-daily newsletter
Don't miss the latest investment and personal finances news, market analysis, plus money-saving tips with our free twice-daily newsletter
So when the bad US data points came out, that gave the green light to buy, baby, buy (with added leverage of course). Even slowing Chinese growth during most of 2015 wasn't enough to spoil this party.
But a transformation has suddenly occurred. In the first couple of trading days this year, traders have finally switched their thinking around and bad economic news is now bad for stocks. Since 29 December, the Dow is off 750 points.
Long-time readers will know that I have been bearish on stockmarkets for some time because I believe the global economy is headed for a deflationary depression. I realise this was a distinct minority opinion in the outer reaches of sanity, but is now gaining some converts as stockmarkets are under pressure, and consumer price inflation data continues to flirt around the zero line.
Of course, under the surface most stocks were weakening in 2015, particularly in the latter half. It was the headline Dow and S&P indexes that kept their heads above water the smaller cap indexes were losing ground.
Below is the daily chart of the Russell 2000 index of small caps. The high was made in June and from there, the market has traced out the Elliott waves shown. From the August low, the market made an A-B-C correction with the C wave hitting the Fibonacci 62% level. Remember, this pattern of three motive waves down/A-B-C up to the Fibonacci 62% level is one of my top trading set-ups:
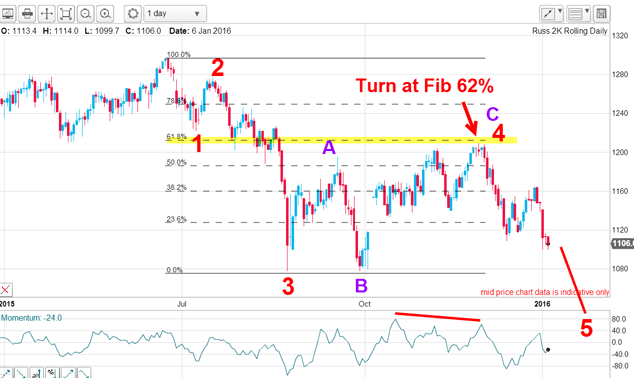
Now the market is in its fifth wave down (note the small A-B-C upward correction last month), my forecast is for new lows below the 1,080 area.
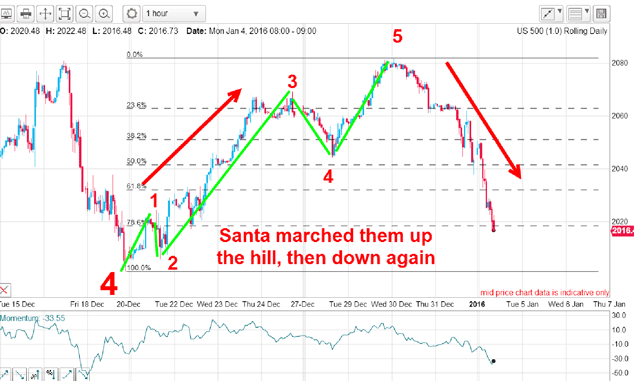
On Monday, I had lines in the sand in the Dow and S&P and both are being tested this week. This was the S&P hourly chart I showed then:
Here is the updated chart expanded to show my line in the sand where previous declines were stopped:
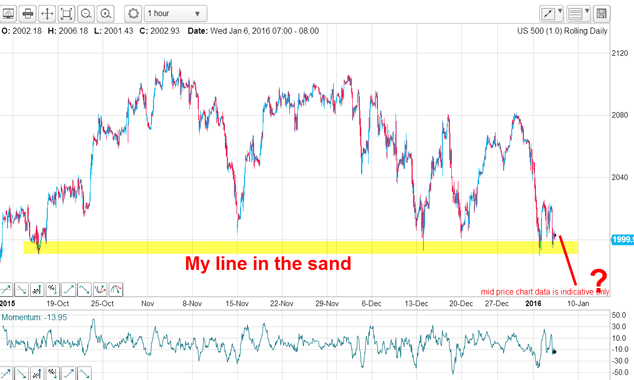
With several accurate touch points, Mr Market considers this line around the 2,000 level to be very significant. A hard break down through it would change it from a line of support to a line of resistance.
The move down off the 29 December high looks like it needs one more move down below the 2,000 level to complete a small five down. The correction of the last few hours appears to be a small fourth wave.
If so, the end of this fifth wave would be my wave 1 of a large pattern that should develop into a large five down.
So here is my take on the long-term pattern:
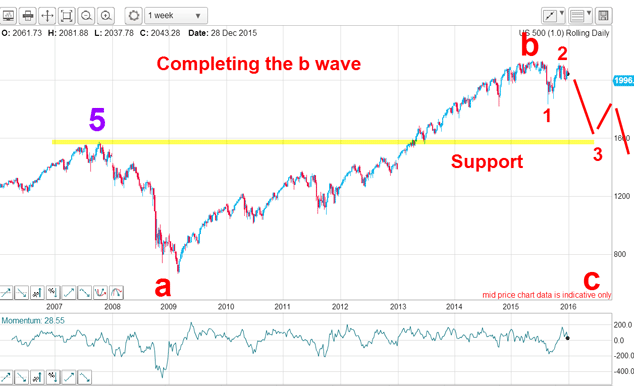
The entire rally since 2009 is a gigantic b wave, which has the characteristics of a second wave. And second waves are false waves in the sense that the prevailing beliefs are phony and will be revealed as such as wave c develops (especially so in third waves). As I outlined above, I believe this process of transformation has started.
By the end of the year, stocks will be much lower, and the Fed, along with other central banks, will be reviled. One reason? They have followed their long-established practice of raising interest rates at the top of the market. This policy will be heavily criticised this year. Watch out below!
Get the latest financial news, insights and expert analysis from our award-winning MoneyWeek team, to help you understand what really matters when it comes to your finances.
John is is a British-born lapsed PhD physicist, who previously worked for Nasa on the Mars exploration team. He is a former commodity trading advisor with the US Commodities Futures Trading Commission, and worked in a boutique futures house in California in the 1980s.
He was a partner in one of the first futures newsletter advisory services, based in Washington DC, specialising in pork bellies and currencies. John is primarily a chart-reading trader, having cut his trading teeth in the days before PCs.
As well as his work in the financial world, he has launched, run and sold several 'real' businesses producing 'real' products.
-
 Average UK house price reaches £300,000 for first time, Halifax says
While the average house price has topped £300k, regional disparities still remain, Halifax finds.
-
 Barings Emerging Europe trust bounces back from Russia woes
Barings Emerging Europe trust has added the Middle East and Africa to its mandate, delivering a strong recovery, says Max King
-
 The challenge with currency hedging
A weaker dollar will make currency hedges more appealing, but volatile rates may complicate the results
-
 It's time to back the yen, says Dominic Frisby
The Japanese yen has been weak for a long time, says Dominic Frisby. That may soon change.
-
 Why a strong dollar hurts – and what you can do about it
Analysis The US dollar is at its strongest level in 20 years. That’s bad news for most investment assets, says John Stepek – here’s why
-
 Could a stronger euro bring relief to global markets?
Analysis The European Central Bank is set to end its negative interest rate policy. That should bring some relief to markets, says John Stepek. Here’s why.
-
 HubSpot: a tech stock set to tumble
Tips US tech stocks have had a fantastic couple of years. But this year is unlikely to be so bullish for high-fliers that can’t turn big profits.
-
 What does the future hold for central bank digital currencies?
Briefings Many of the world's central banks – including the Bank of England – have expressed an interest in creating their own digital currencies. Shivani Khandekar looks at the state of play in central bank digital currencies.
-
 DR Horton: US housebuilder that's piling up profits
Tips US housebuilder DR Horton’s stock rests on firm foundations and looks cheap. Matthew Partridge looks at the best way to play it.
-
 DoorDash won't deliver for investors. Here's how to short it
Tips American food-delivery app DoorDash can’t even make money in a pandemic. Matthew Partridge explains the best way to short it.