Stocks surge in massive short squeeze
Speculators are dumping their short bets in droves, says John C Burford. That spells opportunity in the charts for swing traders.
Get the latest financial news, insights and expert analysis from our award-winning MoneyWeek team, to help you understand what really matters when it comes to your finances.
You are now subscribed
Your newsletter sign-up was successful
Want to add more newsletters?

Twice daily
MoneyWeek
Get the latest financial news, insights and expert analysis from our award-winning MoneyWeek team, to help you understand what really matters when it comes to your finances.

Four times a week
Look After My Bills
Sign up to our free money-saving newsletter, filled with the latest news and expert advice to help you find the best tips and deals for managing your bills. Start saving today!
Last Monday, I covered the S&P 500 index which was in rally mode following a plunge to an extreme in bearish sentiment in January. That was when risk was definitely off and the safe havens of gold, the yen and Treasuries much favoured.
A scan of the Commitments of Traders (COT) data showed that speculators had amassed a huge plurality of short bets in stock indexes. That was one stark measure of how risk-off was definitely on.
But that was a week ago when the S&P had just rallied to hit my main target at 1,880, which lay at the Fibonacci 62% retrace of the most recent wave. But did it stop there and reverse?
MoneyWeek
Subscribe to MoneyWeek today and get your first six magazine issues absolutely FREE

Sign up to Money Morning
Don't miss the latest investment and personal finances news, market analysis, plus money-saving tips with our free twice-daily newsletter
Don't miss the latest investment and personal finances news, market analysis, plus money-saving tips with our free twice-daily newsletter
No, it has powered ahead and this morning it trades at the 1,930 level a full 50 points above my first target. And this brings up an important point about my price targets. They are areas where I judge the market will hit in the current move. They are not always areas where all profits can be taken and/or reversed positions taken. That decision depends crucially on my interpretation of the wave pattern that is operating (a very tough task).
That is why I have devised my split-bet strategy. It is simply a means of capturing a profit at the target on only part of your position. Taking half of your longs off at 1,880 and leaving the other half to run with protective stop moved to break even is the correct way to use this strategy. That gives me peace of mind, knowing that I will capture a profit on this trade, no matter what happens now.
And with the market up another 50 big points, I have a terrific profit running on this half and also have the difficult decision on when to take that profit.
This was the hourly chart I showed last Monday:
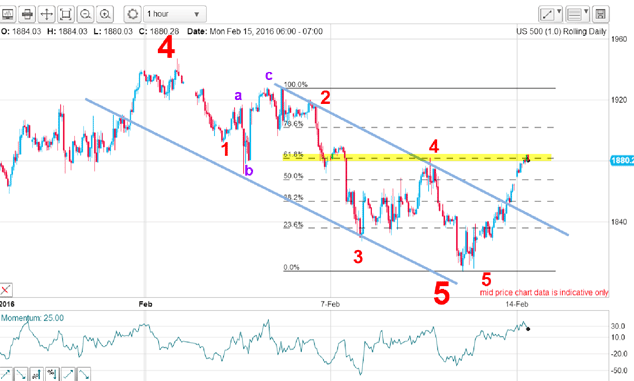
My large fifth wave had completed its own internal five down and the market had broken above my upper tramline to hit my 1,880 target.
This is the current picture:
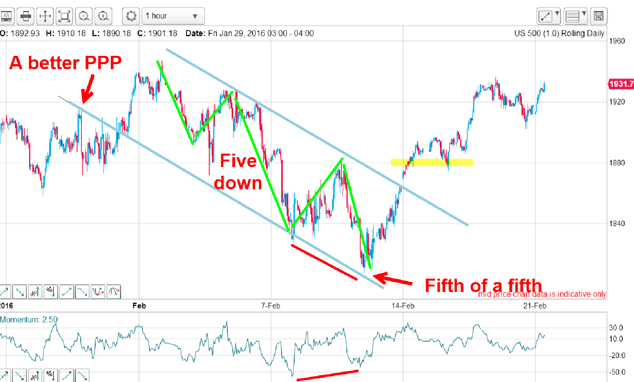
I have slightly amended my blue tramlines to capture the better prior pivot point (PPP), but the result is the same the big move up was flagged by the fifth of a fifth completed and the momentum divergence at that low.
One more point: the push to last week's high appeared to complete a five up, but the wave down was only an A-B-C three-wave affair. And that implied a rally continuation that we are seeing this morning.
When you suspect a five-wave pattern has completed, you naturally expect a three-wave correction. This has been delivered, but it is puny in relation to the big rally off the low. That brings into question my assumption that the five up was complete last week.
Let's look at this rally in more detail:
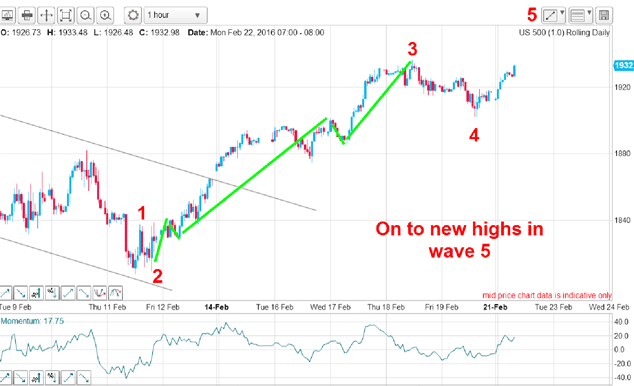
The strong push to last week's high first seemed like a complete five up, but the decline in three waves makes it a great candidate for a fourth wave down. Remember, fourth waves are typically A-B-Cs or a variation. Also, wave sizes and shapes must have the "right look".
My labels are now the most likely pattern operating.
This morning, the market is pushing up to test the wave 3 high, and when it exceeds it, that will confirm we are in the final wave 5 of this move.
Last time, I mentioned that a strong rally was likely based on the bearish sentiment picture provided by the COT data.
Here is the latest data as of last Tuesday:
| (Contracts of $50 x S&P 500 index) | Row 0 - Cell 1 | Row 0 - Cell 2 | Row 0 - Cell 3 | Open interest: 3,842,637 | ||||
| Commitments | ||||||||
| 359,215 | 524,459 | 418,630 | 2,461,271 | 2,540,166 | 3,239,116 | 3,483,255 | 603,522 | 359,382 |
| Changes from 02/09/16 (Change in open interest: 13,285) | ||||||||
| 27,102 | -44,593 | -3,105 | -1,128 | 42,752 | 22,870 | -4,945 | -9,584 | 18,230 |
| Percent of open in terest for each category of traders | ||||||||
| 9.3 | 13.6 | 10.9 | 64.1 | 66.1 | 84.3 | 90.6 | 15.7 | 9.4 |
| Number of traders in each category (Total traders: 636) | ||||||||
| 135 | 155 | 162 | 247 | 264 | 468 | 195 | Row 8 - Cell 7 | Row 8 - Cell 8 |
This data shows that a huge move by the speculators out of short bets and into long ones took place a continuation of the action the previous week. But speculators still hold a large plurality of shorts over longs. My conclusion? There remains plenty of scope for more short squeezing and further gains for stocks. This brings up an intriguing possibility. Here is the daily chart back to 2014:
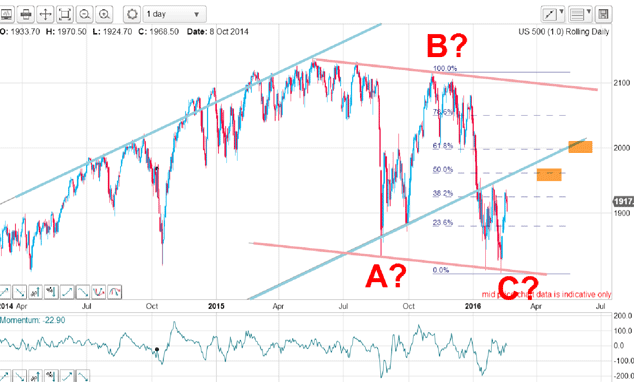
The blue tramlines is my main set drawn off the 2009 lows. The decline off last year's all-time high can be counted an A-B-C, which is counter to the main up trend. In fact, wave A = wave C in height which is a typical wave relationship.
If this is correct, my Fibonacci targets are shown with the major Fibonacci 62% target at the 2,000 area, which rather conveniently is the underside of the lower blue tramline. Hmm.
But if the above C wave low is also the larger wave 4 low, we are on to new all-time highs. And that would set the shorts running for cover!
Get the latest financial news, insights and expert analysis from our award-winning MoneyWeek team, to help you understand what really matters when it comes to your finances.
John is is a British-born lapsed PhD physicist, who previously worked for Nasa on the Mars exploration team. He is a former commodity trading advisor with the US Commodities Futures Trading Commission, and worked in a boutique futures house in California in the 1980s.
He was a partner in one of the first futures newsletter advisory services, based in Washington DC, specialising in pork bellies and currencies. John is primarily a chart-reading trader, having cut his trading teeth in the days before PCs.
As well as his work in the financial world, he has launched, run and sold several 'real' businesses producing 'real' products.
-
 Average UK house price reaches £300,000 for first time, Halifax says
While the average house price has topped £300k, regional disparities still remain, Halifax finds.
-
 Barings Emerging Europe trust bounces back from Russia woes
Barings Emerging Europe trust has added the Middle East and Africa to its mandate, delivering a strong recovery, says Max King
-
 DR Horton: US housebuilder that's piling up profits
Tips US housebuilder DR Horton’s stock rests on firm foundations and looks cheap. Matthew Partridge looks at the best way to play it.
-
 DoorDash won't deliver for investors. Here's how to short it
Tips American food-delivery app DoorDash can’t even make money in a pandemic. Matthew Partridge explains the best way to short it.
-
 Trading: it’s time for investors to dump Match.com
Tips The dating group is grappling with regulators and looks absurdly expensive.
-
 Build profits with this industrial equipment rentals company
Tips United Rentals is poised to benefit from higher spending on infrastructure. Matthew Partridge explains the best way to play it.
-
 Is Google parent company Alphabet in the soup?
Features Investors in tech giants such as Alphabet were happy to drive up the valuations, says John C Burford. But now patience has run out.
-
 Which stockmarket is down 99.986% since 2007?
Features One European stockmarket has lost virtually all its value since the financial crisis. We'll see more of the same before the current crash is out, says John C Burford.
-
 Bad news isn’t good news for stocks anymore
Features Last year, the mantra was “bad news is good for stocks”. Now, it looks like traders have finally switched their thinking around, says John C Burford.
-
Spread betting: A tax-free way to trade
Features Spread betting is Britain's favourite way of using borrowed money to play the stockmarket. And you don't have to pay on your profits. Here's how it works.