More downside for the Dow this week?
As if banking a 450-pip profit in the Dow wasn't enough, John C Burford still has one more iron in the fire. Here, he explains how to use his 'split bet strategy'.
Get the latest financial news, insights and expert analysis from our award-winning MoneyWeek team, to help you understand what really matters when it comes to your finances.
You are now subscribed
Your newsletter sign-up was successful
Want to add more newsletters?

Twice daily
MoneyWeek
Get the latest financial news, insights and expert analysis from our award-winning MoneyWeek team, to help you understand what really matters when it comes to your finances.

Four times a week
Look After My Bills
Sign up to our free money-saving newsletter, filled with the latest news and expert advice to help you find the best tips and deals for managing your bills. Start saving today!
On Friday I outlined my short-term trade in the Dow that netted 450 pips. But that is not the end of the story. In fact, I still have a short position working!
How can that be, I hear you ask?
The short answer is that I am using my split bet strategy, which I fully explained in my recent workshops.
MoneyWeek
Subscribe to MoneyWeek today and get your first six magazine issues absolutely FREE

Sign up to Money Morning
Don't miss the latest investment and personal finances news, market analysis, plus money-saving tips with our free twice-daily newsletter
Don't miss the latest investment and personal finances news, market analysis, plus money-saving tips with our free twice-daily newsletter
Here is how it works. When you get a buy or sell signal from your trading method, you enter in units of £2 per pip (say, £4, £6, £8, and so on, depending on the size of your account).
You use one half of the bet as a short-term trade, where you set your short-term target and exit that trade there for a profit. Then you use the other half as a longer-term bet with more distant objectives.
That is what I did last week as I covered one half of my short position in my 13,000 target area for the 450-pip gain. That profit is now banked.
I have the other half still open, and now I can adjust my protect-profit stop to break-even, following my rule. So whatever happens, I will suffer no loss on this part of the trade. That is a very low-stress position to be in, having banked 450 pips and a worst case scenario of no more gains or losses.
My options now include adjusting my protect-profit stop as the market (hopefully) falls (the trailing stop strategy), or seeking a new target and taking the profit there.
And that is not all I can do! Since I judge the market has lots of downside potential I can look to re-instate my original half bet as a new short (on a rally, of course).
And today, I believe I have a great example of how this can work in the Dow.
How to split bet on the Dow
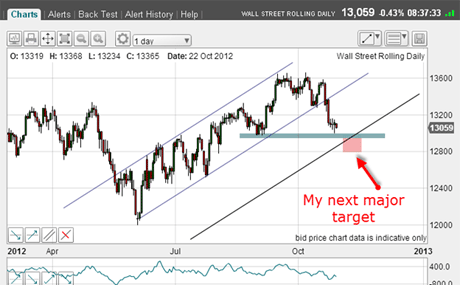
Here is the daily chart:

(Click on image above for larger version)
We are testing major support at the 13,000 round figure level (blue bar) and I have marked my next major tramline target in pink. That will be my target for the long-term half of my original trade. But remember, I do not have to take profits at the target much will depend on the chart patterns yet to be made.
This means that I believe there is more to go on the downside and why I am looking for another possible short entry point to reinstate the other half of my overall bet.
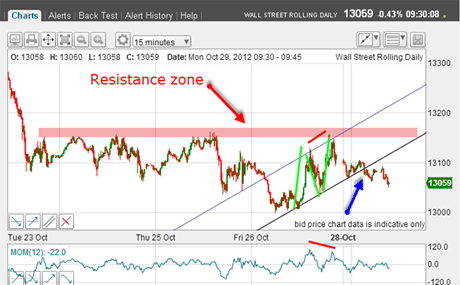
So let's see what the hourly chart tells me:

(Click on image above for larger version)
OK, I covered my half bet on Friday and the market staged the expected bounce afterwards.
This bounce completed a lovely A-B-C (corrective) pattern (green bars) complete with a nice negative momentum divergence (red bars), and the C wave entered the region of previous resistance (pink zone).
This morning, the market has broken below my lower tramline (blue arrow) note the lovely prior pivot point (PPP) on the upper tramline!
This, then, has all the hallmarks of a failed rally' and the path of least resistance appears to be down towards my major target.
The market may attempt a rally to kiss the underside of the lower tramline a common event, as you know from many of my previous emails. That means a protective stop just above the lower tramline is indicated for a risk of around 75 pips.
If the market does rally from here my stop will be hit and I will suffer a loss of 75 pips, thereby reducing my overall profit to 450 75 = 375 pips. And I will still have my half bet short at the 13,490 level open.
I hope you see that there are many strategies you can employ to balance risk against reward. But the golden rule in all of them is: never stray from your strict money management rules.
US public sentiment is falling
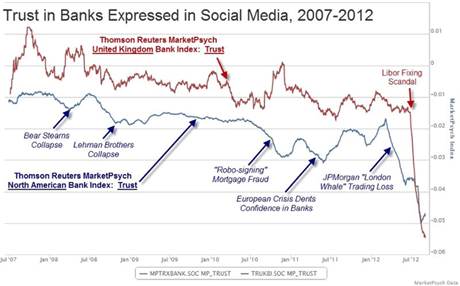
From time to time I come across a really startling chart that expresses at a glance a major theme in the markets and here is one:

(Chart courtesy of MarketPsych.com Click on image above for larger version)
Recently, some clever analysts have discovered distinct trends in public sentiment as expressed in social media (Twitter, Facebook, et al). So many people use social media that it is a gold mine for these analysts.
Here is a chart of the MarketPsych index of public trust in banks in the US (blue) and the UK (red). The collapse in trust that happened in January '12is remarkable, is it not?
And it is not so great a leap to extrapolate this finding to say trust in the financial markets is also taking a similar dump. Massive selling of stock mutual funds by US retail investors attests to this. The added factor here is the need for cash hence the selling.
If I am correct, this new pessimism from the public (which stands in stark contrast to the professionals) will show up in the forthcoming US economic indicators. This is something to watch for this winter. But, of course, the stock market will be ahead of this.
Of course, we have several major market events looming the presidential election and the fiscal cliff to name but two and we should all expect volatility to ramp up into November, producing wilder swings.
We live in interesting times!
If you're a new reader, or need a reminder about some of the methods I refer to in my trades, then do have a look at my introductory videos:
The essentials of tramline trading
An introduction to Elliott wave theory
Advanced trading with Elliott waves
Don't miss my next trading insight. To receive all my spread betting blog posts by email, as soon as I've written them, just sign up here . If you have any queries regarding MoneyWeek Trader, please contact us here.
Get the latest financial news, insights and expert analysis from our award-winning MoneyWeek team, to help you understand what really matters when it comes to your finances.
John is is a British-born lapsed PhD physicist, who previously worked for Nasa on the Mars exploration team. He is a former commodity trading advisor with the US Commodities Futures Trading Commission, and worked in a boutique futures house in California in the 1980s.
He was a partner in one of the first futures newsletter advisory services, based in Washington DC, specialising in pork bellies and currencies. John is primarily a chart-reading trader, having cut his trading teeth in the days before PCs.
As well as his work in the financial world, he has launched, run and sold several 'real' businesses producing 'real' products.
-
 Can mining stocks deliver golden gains?
With gold and silver prices having outperformed the stock markets last year, mining stocks can be an effective, if volatile, means of gaining exposure
-
 8 ways the ‘sandwich generation’ can protect wealth
People squeezed between caring for ageing parents and adult children or younger grandchildren – known as the ‘sandwich generation’ – are at risk of neglecting their own financial planning. Here’s how to protect yourself and your loved ones’ wealth.