The Dow Jones and S&P 500 are diverging
America's Dow and S&P stocks indices are displaying different Elliott wave patterns. John C Burford explains why that matters to traders.
Get the latest financial news, insights and expert analysis from our award-winning MoneyWeek team, to help you understand what really matters when it comes to your finances.
You are now subscribed
Your newsletter sign-up was successful
Want to add more newsletters?

Twice daily
MoneyWeek
Get the latest financial news, insights and expert analysis from our award-winning MoneyWeek team, to help you understand what really matters when it comes to your finances.

Four times a week
Look After My Bills
Sign up to our free money-saving newsletter, filled with the latest news and expert advice to help you find the best tips and deals for managing your bills. Start saving today!
Although my favourite stock index for trading is the Dow, I do keep a close eye on the S&P 500 (and the Nasdaq), because sometimes they display slightly differing Elliott wave patterns.
And this is exactly what has happened in the S&P since the 14 May highs. So today, I will tell you why this is such a significant development.
The Dow and S&P part ways
MoneyWeek
Subscribe to MoneyWeek today and get your first six magazine issues absolutely FREE

Sign up to Money Morning
Don't miss the latest investment and personal finances news, market analysis, plus money-saving tips with our free twice-daily newsletter
Don't miss the latest investment and personal finances news, market analysis, plus money-saving tips with our free twice-daily newsletter
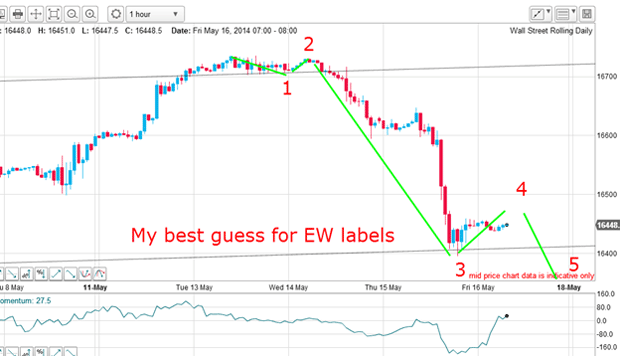
The wave 3 appeared correct, because it was long and strong, which is the normal quality for a third wave. It is usually the strongest (in terms of momentum) of the three waves that move in the overall direction of trend.
I was then waiting for the wave 4 to top out before the market descended once again to a new low in the final fifth wave.
But the S&P chart offered a slightly different interpretation. Here is the hourly chart as of this morning:
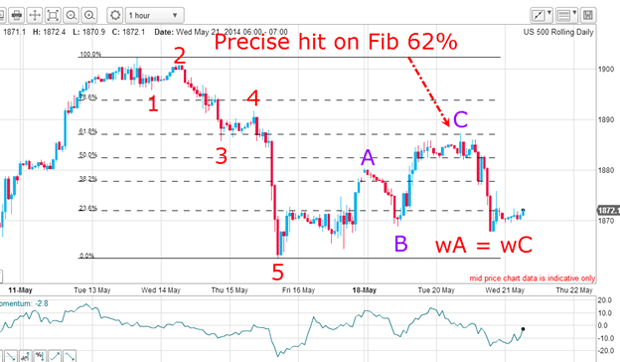
I have a shorter wave 3 and a long and strong fifth wave. These are called extended fifths and although not common, they do appear more often in the stock indexes than in any other type of market that I follow.
This is an acceptable way to label the big move down. At the wave 5 low, the selling had been overdone and the market started a normal relief rally.
This is a textbook rally
First, it has an A-B-C form with wA equal in height to wC. This is a typical Fibonacci wave relationship between the corrective A and C waves. That is textbook behaviour and illustrates the equality rule of the A and C waves.
In fact, when you see this equality, it adds confidence to your interpretation that this is indeed a relief rally and to expect a resumption of the main down trend.
Second, wave C terminated precisely at the Fibonacci 62% retracement of the entire move down. This is the most common level where C waves turn around. And the hit was made on a pigtail, or spike, on the high bar. Again, all of this is straight out of the textbook.
And yesterday the market fell hard off the C wave high. So now I can place new Elliott wave labels for the larger pattern:
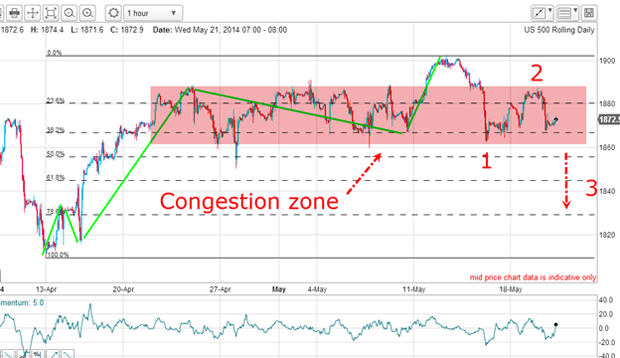
My new wave 1 is the 15 May low and wave 2 is yesterday's C wave high. To confirm this picture, I will need to see a new low below the wave 1 low and out of the congestion zone.
Note the large congestion zone (marked in pink) whose upper limit was breached in the buying exhaustion thrust to the 1900 level. But that was a false breakout and the market soon plunged to test the lower limit of the zone. That is entirely normal behaviour.
And the upper limit of resistance was tested yesterday and was successful in turning the market back with force.
Why were investors flocking to the Dow?
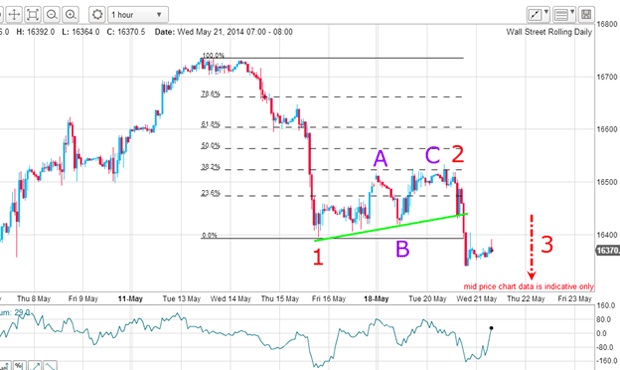
The pattern is very similar, but the Dow has already made a new low below the wave 1 low. This means we are very likely already in the third wave down.
Note how much weaker the Dow is now compared with the S&P. The Dow C wave high terminated only at the Fibonacci 38% level compared with the higher 62% level in the S&P. And now we have a new low in the Dow and not in the S&P.
This is a turn-around from the recent pattern. The Dow has recently seen a flow of funds as investors seek solid dividend-paying companies in a flight from the riskier S&P shares. I believe this is a significant development.
Keeping an eye on the bigger picture
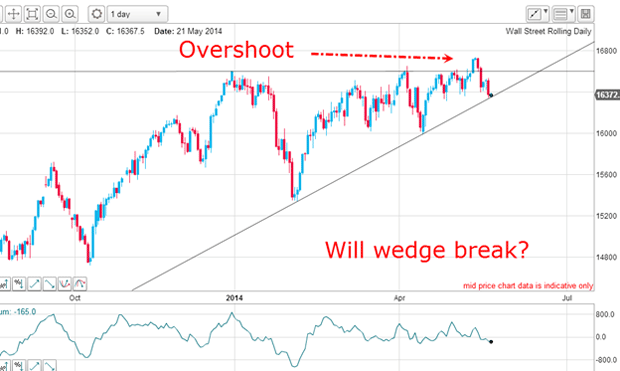
I can draw a lovely wedge, and this morning the market is testing the lower line. A solid break of this line would confirm not only the top, but that we are in the third wave down, which should be long and strong.
This could get very interesting!
Get the latest financial news, insights and expert analysis from our award-winning MoneyWeek team, to help you understand what really matters when it comes to your finances.
John is is a British-born lapsed PhD physicist, who previously worked for Nasa on the Mars exploration team. He is a former commodity trading advisor with the US Commodities Futures Trading Commission, and worked in a boutique futures house in California in the 1980s.
He was a partner in one of the first futures newsletter advisory services, based in Washington DC, specialising in pork bellies and currencies. John is primarily a chart-reading trader, having cut his trading teeth in the days before PCs.
As well as his work in the financial world, he has launched, run and sold several 'real' businesses producing 'real' products.
-
 Can mining stocks deliver golden gains?
With gold and silver prices having outperformed the stock markets last year, mining stocks can be an effective, if volatile, means of gaining exposure
-
 8 ways the ‘sandwich generation’ can protect wealth
People squeezed between caring for ageing parents and adult children or younger grandchildren – known as the ‘sandwich generation’ – are at risk of neglecting their own financial planning. Here’s how to protect yourself and your loved ones’ wealth.
-
 DR Horton: US housebuilder that's piling up profits
Tips US housebuilder DR Horton’s stock rests on firm foundations and looks cheap. Matthew Partridge looks at the best way to play it.
-
 DoorDash won't deliver for investors. Here's how to short it
Tips American food-delivery app DoorDash can’t even make money in a pandemic. Matthew Partridge explains the best way to short it.
-
 Trading: it’s time for investors to dump Match.com
Tips The dating group is grappling with regulators and looks absurdly expensive.
-
 Build profits with this industrial equipment rentals company
Tips United Rentals is poised to benefit from higher spending on infrastructure. Matthew Partridge explains the best way to play it.
-
 Stocks surge in massive short squeeze
Features Speculators are dumping their short bets in droves, says John C Burford. That spells opportunity in the charts for swing traders.
-
 Is Google parent company Alphabet in the soup?
Features Investors in tech giants such as Alphabet were happy to drive up the valuations, says John C Burford. But now patience has run out.
-
 Which stockmarket is down 99.986% since 2007?
Features One European stockmarket has lost virtually all its value since the financial crisis. We'll see more of the same before the current crash is out, says John C Burford.
-
 Bad news isn’t good news for stocks anymore
Features Last year, the mantra was “bad news is good for stocks”. Now, it looks like traders have finally switched their thinking around, says John C Burford.