The Dow hits a new high – but will it last?
Many pundits have declared the start of a major bull-market in the Dow. Are they right? John C Burford checks the charts.
Get the latest financial news, insights and expert analysis from our award-winning MoneyWeek team, to help you understand what really matters when it comes to your finances.
You are now subscribed
Your newsletter sign-up was successful
Want to add more newsletters?

Twice daily
MoneyWeek
Get the latest financial news, insights and expert analysis from our award-winning MoneyWeek team, to help you understand what really matters when it comes to your finances.

Four times a week
Look After My Bills
Sign up to our free money-saving newsletter, filled with the latest news and expert advice to help you find the best tips and deals for managing your bills. Start saving today!
In my 9 May post, I asked the question: Are stocks in a bubble? Of course, this is a 'how long is a piece of string' question. It is more a meta-physical argument than a proper question for traders who live or die by the trading decisions they make. For traders, the correct question is this: "Is the stock-market rally about to terminate or continue?"
Recall I had the 16,600 level on the Dow as my critical level - that was my line in the sand. On Tuesday, the market girded its loins and closed above it for the very first time in history. So, was this the start of a massive push higher on the back of this broken resistance?
Many pundits have been calling this the start of a massive bull move. Based on their reading of the global economies, they proclaim the US economy has lift-off' and the Fed's quantitative easing tapering policy will have no more bearing on asset prices they are self-sustaining. We shall see.
MoneyWeek
Subscribe to MoneyWeek today and get your first six magazine issues absolutely FREE

Sign up to Money Morning
Don't miss the latest investment and personal finances news, market analysis, plus money-saving tips with our free twice-daily newsletter
Don't miss the latest investment and personal finances news, market analysis, plus money-saving tips with our free twice-daily newsletter
The litmus test for sustainable highs
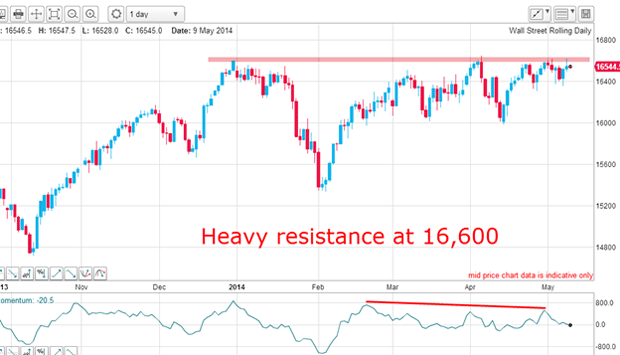
Many chartists would agree the 16,600 level was critical after all, resistance that had built up since the 31 December high has finally been broken with a closing high into new high ground at the 16,700 level on Tuesday and Wednesday.
But experienced chartists are more cautious. They want to see the market's reaction to this new all-time high before confirming the continuation of the rally. They wish to check if the new high can be sustained by strong buying for a few days after the initial break. This is their litmus test.
If the market cannot sustain the rally with new buying, it will fall back. A close under the 16,600 level would signal that the poke above it was very likely a buying exhaustion. This is called an overshoot on the charts. We see plenty of these on my tramlines.
Is this a genuine break?
I have found that two to three days is the usual period to look for a reversal. If the market has not turned back within this time frame, then the break is likely genuine.
This is the daily chart as of this morning:
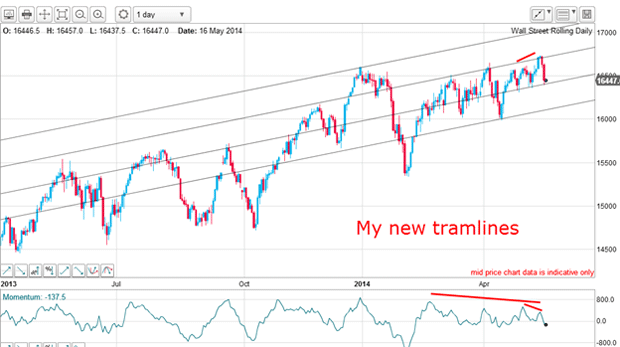
I have drawn in my best fit for four tramlines and there are many good touch points along all of the lines.
Yesterday, the market fell to my third tramline from the top and is currently testing it as I write. Note the negative-momentum divergences which confirm the buying exhaustion theme.
Let's zoom in for a closer look on the hourly:
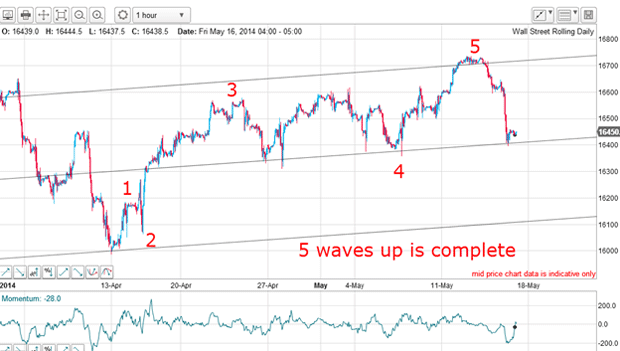
From the 13 April low, there is a clear five-wave pattern with a complex fourth wave (as is normal).
Now the market is testing the tramline support and there should be a bounce here. But if not, then the tramline support will break and my lower tramline becomes my next target.
Proof that markets are patterned
Here is the hourly chart with my best guess for the Elliott wave labels:
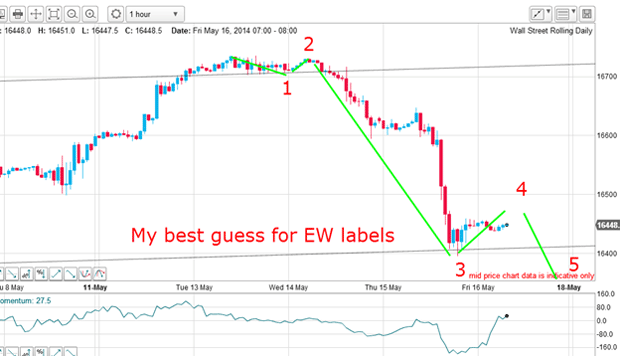
All of the Elliott wave rules and guidelines are obeyed, including a long and strong third wave to yesterday's 16,400 low. If this is correct, we are currently in a fourth wave up and when it terminates, we will see a new low in the fifth wave and this implies the tramline support at 16,400 would give way.
Note that the third wave also contains five sub waves with an extended fifth wave:
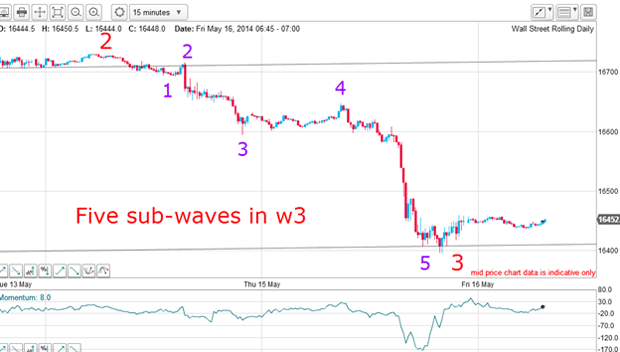
This demonstrates again that markets are fractals and the very same patterns repeat in smaller and smaller time scales.
As an exercise, see if you can detect a smaller five-wave pattern within my sub-fifth wave.
Don't let stress kill your performance
Because I had a hunch the move up to the 16,700 level was likely to be buying exhaustion (see previous posts detailing my bearish stance), I was ready to test the downside. I set a sell-stop just below the wave 1 low (see fourth chart down), hoping for a third wave move, which would have the tell-tale long and strong' signature.
If this order was to be filled, I would set my protective stop just above the wave 2 high using my 3% rule.
And my order was duly touched on Wednesday noon and the market then fell very hard. Because I was using my split-bet strategy, when the market collapsed to the 16,400 level yesterday onto my tramline support, I took one half profits of 280 pips and left the other half open and moved my protective stop to break even. That is my rule when I have a winning trade.
This gives me extra flexibility and with money in the bank, I am in a relatively stress-free position unlike the vast majority of traders who trade emotionally and constantly worry about their trades.
I encourage all traders to find ways of managing stress, because it can be a killer to your performance. All you need is a proven trading and money management system and stick to it at all times!
So now I have a winning half position open and looking for the wave 4 high in order to re-establish the other half, looking for a break of the 16,400 level.
Longer-term, I have more targets and I will explain these in future posts.
Get the latest financial news, insights and expert analysis from our award-winning MoneyWeek team, to help you understand what really matters when it comes to your finances.
John is is a British-born lapsed PhD physicist, who previously worked for Nasa on the Mars exploration team. He is a former commodity trading advisor with the US Commodities Futures Trading Commission, and worked in a boutique futures house in California in the 1980s.
He was a partner in one of the first futures newsletter advisory services, based in Washington DC, specialising in pork bellies and currencies. John is primarily a chart-reading trader, having cut his trading teeth in the days before PCs.
As well as his work in the financial world, he has launched, run and sold several 'real' businesses producing 'real' products.
-
 UK interest rates live: rates held at 3.75%
The Bank of England’s Monetary Policy Committee (MPC) met today to decide UK interest rates, and voted to hold rates at their current level
-
 MoneyWeek Talks: The funds to choose in 2026
Podcast Fidelity's Tom Stevenson reveals his top three funds for 2026 for your ISA or self-invested personal pension