You are now subscribed
Your newsletter sign-up was successful
Want to add more newsletters?

Twice daily
MoneyWeek
Get the latest financial news, insights and expert analysis from our award-winning MoneyWeek team, to help you understand what really matters when it comes to your finances.

Four times a week
Look After My Bills
Sign up to our free money-saving newsletter, filled with the latest news and expert advice to help you find the best tips and deals for managing your bills. Start saving today!
On Wednesday, the market was in a strong rally mode and I was working a long trade.
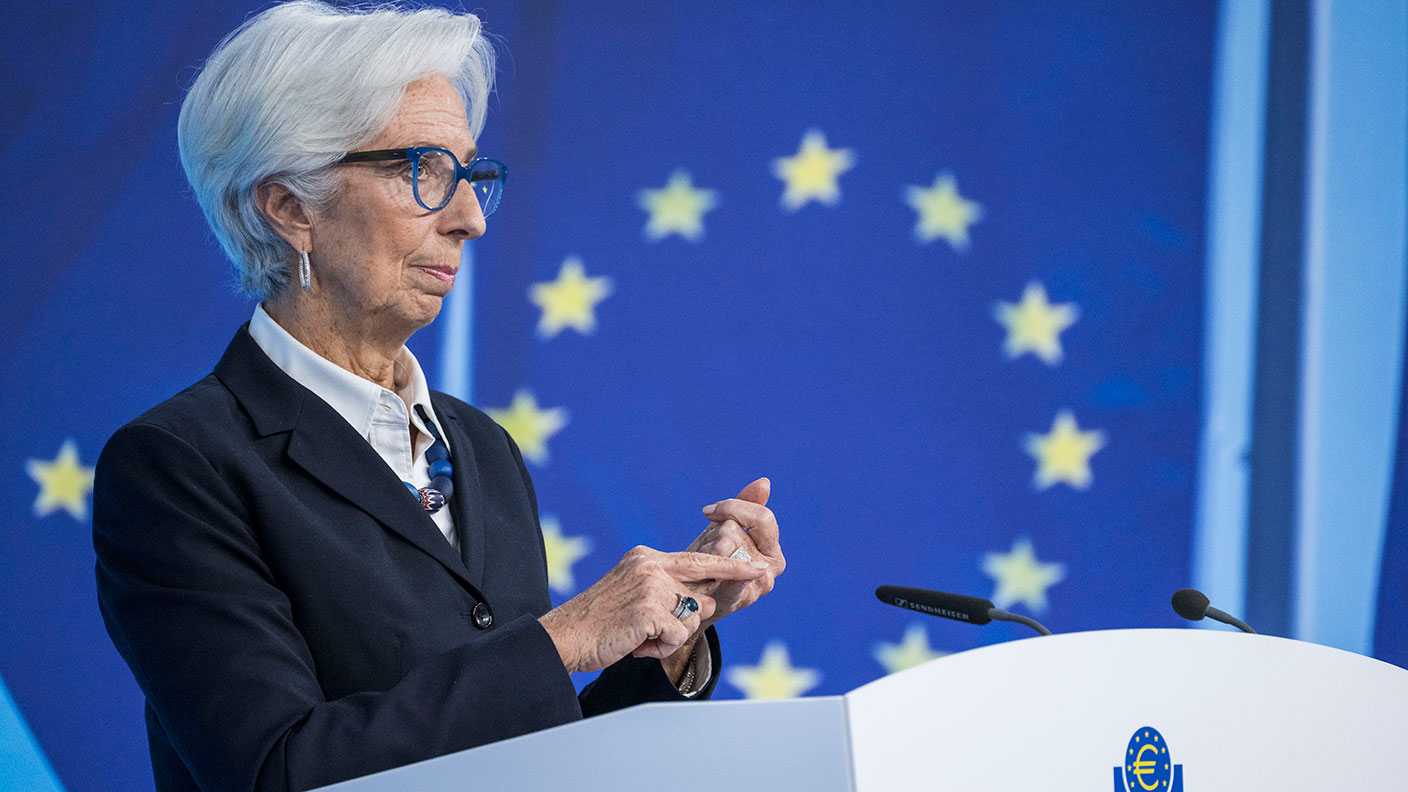
And yesterday, the long-awaited announcement from the European Central Bank(ECB) revealed thatit was loweringits policy rate from 0.75% to 0.5%.
MoneyWeek
Subscribe to MoneyWeek today and get your first six magazine issues absolutely FREE

Sign up to Money Morning
Don't miss the latest investment and personal finances news, market analysis, plus money-saving tips with our free twice-daily newsletter
Don't miss the latest investment and personal finances news, market analysis, plus money-saving tips with our free twice-daily newsletter
I have written recently about the misconception that it is policy decisions that drive markets. For example, the ECB's recent decision to lower rates. It is actually the negative sentiment in the eurozone which is producing the weak numbers, which is forcing the ECB to lower rates.
Why I decided to lighten my position
On Wednesday, the market was approaching the 1.32 level on the strong rally.
This is what I wrote: "Now, the next target is the previous major high at 1.32 set on 16 April. I imagine that there are plenty of buy stops sitting right there."
And sure enough, the market squeezed those shorts a little more tightly and took out the 1.32 level:
(Click on the chart for a larger version)
Now, with that important 16 April high taken out, the question all traders need to ask is this: Is there enough gas in the tank to sustain the rally?
Many experienced traders have a policy of always fading these situations, especially after a sharp move, such as we have seen here. Fading' simply means selling short into the move above the old high at 1.32.
Now, you run the risk of being on the wrong side of a massive trending market, of course. But that is what stops were invented for.
On balance, I have found that more often than not, the markets pull back from their rally after the surge of buy stops has been exhausted.
I decided to lighten up on my position, since Wednesday was the eve of the ECB announcement, and I expected increased volatility. I had a decent profit and I was not about to get greedy.
I offset part of myposition around the 1.32 level and placed a protect-profit stop on the remainder around the 1.3140 level.
And this is how the ECB news was taken:
(Click on the chart for a larger version)
First, the market rallied above 1.32 (red arrow) in gladness that the new rate was not below zero, but then had a swift change of heart and sank 150 pips in an hour or so (blue arrow) as traders punished those who took long positions above 1.32 by running their sell-stops.
It's a cruel world in the space of a few hours, both longs and the shorts were punished, and the market has ended up in exactly the same spot it was on Tuesday!
Let's take a look at the bigger picture
(Click on the chart for a larger version)
Wednesday's rally high took it to the exact Fibonacci 50% retrace, so that was another reason for me to take profits.
Also, the rally from early April has a nice A-B-C form to it (green bars), suggesting this is a counter-trend move and the one larger down trend remains intact.
To cap it off, there is a stark negative-momentum divergence at Wednesday's C wave high.
This is as close to textbook as you'll find.
Nailing that closing price
So can I find a suitable entry this morning? Let's zoom in on the 15-minute chart:
(Click on the chart for a larger version)
Using yesterday's high and low as pivot points, I can place my Fibonacci tool.
And as I write, the rally has carried to the 38% level and appears to be stalling. This rally has an A-B-C feel to it, so the relief rally could be complete here.
But later today, there is yet another important economic report: the US employment situation, which will also be closely watched. This could induce added volatility again to the dollar.
Ideally though, the rally would carry to the 50% level above 1.3120, where a trade could be entered. Based on my analysis the 62% level is also a potential turning point.
If you're a new reader, or need a reminder about some of the methods I refer to in my trades, then do have a look at my introductory videos:
The essentials of tramline trading Advanced tramline trading An introduction to Elliott wave theory Advanced trading with Elliott waves Trading with Fibonacci levels Trading with 'momentum' Putting it all together
Don't miss my next trading insight. To receive all my spread betting blog posts by email, as soon as I've written them, just sign up here . If you have any queries regarding MoneyWeek Trader, please contact us here.
-
 Average UK house price reaches £300,000 for first time, Halifax says
While the average house price has topped £300k, regional disparities still remain, Halifax finds.
-
 Barings Emerging Europe trust bounces back from Russia woes
Barings Emerging Europe trust has added the Middle East and Africa to its mandate, delivering a strong recovery, says Max King


-
 Investors dash into the US dollar
News The value of the US dollar has soared as investors pile in. The euro has hit parity, while the Japanese yen and the Swedish krona have fared even worse.
-
 Could a stronger euro bring relief to global markets?
Analysis The European Central Bank is set to end its negative interest rate policy. That should bring some relief to markets, says John Stepek. Here’s why.
-
 A weakening US dollar is good news for markets – but will it continue?
Opinion The US dollar – the most important currency in the world – is on the slide. And that's good news for the stockmarket rally. John Stepek looks at what could derail things.
-
 What the Latin Monetary Union – Europe’s forgotten currency – can teach us about the euro
Opinion The euro isn’t the continent’s first flawed single currency, says Jonathan Compton. The Latin Monetary Union lasted 61 years.
-
 How the US dollar standard is now suffocating the global economy
News In times of crisis, everyone wants cash. But not just any cash – they want the US dollar. John Stepek explains why the rush for dollars is putting a big dent in an already fragile global economy.
-
 Currency Corner: A lesson from two of the world’s “hardest” currencies
Features Dominic Frisby looks at the Swiss franc and Singaporean dollar and what our politicians can learn from these two fiscally responsible nations.
-
 Betting on politics: deal or no deal
Features Matthew Partridge looks at the bookies' odds on the UK leaving the EU with no deal.
-
 Betting on politics: how my tips have fared over the last three years
Features It's been three years since Matthew Partridge launched his Betting on Politics column. As you might expect, he's some failures – but he's had a lot more successes


