Don’t be fooled by market stories
People who trade the markets off the back of what they've seen in the news are setting themselves up for a fall, says John C Burford. Here, he explains a better way to trade.
Get the latest financial news, insights and expert analysis from our award-winning MoneyWeek team, to help you understand what really matters when it comes to your finances.
You are now subscribed
Your newsletter sign-up was successful
Want to add more newsletters?

Twice daily
MoneyWeek
Get the latest financial news, insights and expert analysis from our award-winning MoneyWeek team, to help you understand what really matters when it comes to your finances.

Four times a week
Look After My Bills
Sign up to our free money-saving newsletter, filled with the latest news and expert advice to help you find the best tips and deals for managing your bills. Start saving today!
On Wednesday, I wrote about the way people perceive markets wrongly. Because you can't think about markets in the normal cause and effect' way we're familiar with.
Imagine a snooker table with only the white and black ball remaining. Now imagine the player takes a series of shots with his action exactly the same every time, and the balls in exactly the same position for every shot.
You can guarantee that with everything identical, we will see identical results with the balls landing up in the same position every time. Maybe he pots the black the first time, and then every other time.
MoneyWeek
Subscribe to MoneyWeek today and get your first six magazine issues absolutely FREE

Sign up to Money Morning
Don't miss the latest investment and personal finances news, market analysis, plus money-saving tips with our free twice-daily newsletter
Don't miss the latest investment and personal finances news, market analysis, plus money-saving tips with our free twice-daily newsletter
This is because the cue and the balls obey the physical laws of motion every time.
For most of our lives, the law of cause and effect' can help us predict outcomes with high accuracy. But not in the markets!
Now imagine the stock market when some bearish' news is released. From experience we know that sometimes the market rallies, and sometimes it falls. There certainly seems to be no cause and effect model at work here.
Here is a very recent example this week. This is an extract from an article I came across:
Here's a brief rundown of some of the data we saw in the last 12 hours:
U.S. Flash PMI came in at 52, weaker than expected and down from 54.6 last month.
German Flash PMI hit a six month low of 48.8.
China PMI hit a two month low of 50.5, down from 51.6 last month.
Richmond Fed Manufacturing came in at -6 vs expectations of a +3 reading.
Redbook sales were up just 1.8%, down from 2% last week.
New home sales came in at 417K, below estimates of 419K, but up from last month's 411K.
So, not a great day for data. And yet the equity markets in Europe were up 1-3% and the S&P is up over 1%. No one I've talked to can make a whole lot of sense of this.
So weak data was released, yet the Dow staged a 200-plus pip rally!
This is a not an unusual event, and I am sure you will have come across many such perverse' actions before.
(I haveunderlined the last crucial sentence.)
From this, it is clear that the author (and his friends) believe that it is the economic news that makes the markets move. That is their paradigm.
Cause = good economic data. Effect = market rally.
Most people believe this. The mainstreammedia does. Most experts' do.
But they have a problem. How can you explain this week's perverse action with this frame of reference? Clearly, it's not possible.
So what would you do if you were faced with this dilemma?
I can tell you that most would shrug it off and say it was an aberration, or even come up with pseudo-rational explanations that sound good, and if dressed in enough fancy jargon, tables of figures and charts, could convince some.
The phrase this time it's different' was coined for such people!
That is why I do not advise traders read too much, apart from as a rough guide to market sentiment.
What only a few would do is this: question their core belief when faced with the conflicting evidence, and then look for another paradigm that could fit the facts.
If you are one of these enlightened people, I salute you!
I cannot stress too much how, if you cling to the conventional view, you will be totally unprepared for major market turns. This is because market tops are always accompanied by high bullish readings and most are bullish at tops because they interpret the news in a bullish light, influenced as they are by the herd. That means that even bad' news is considered good.
A better model is this: the markets are driven by the unseen herding impulses that govern the majority. This impulse is totally unconscious and determines the strength of bullish and bearish tendencies. And these impulses are internal to the market.
Most of us would deny we are part of a herd. We are independent free-thinkers! But sadly, this isn't so.
And it is the changes over time in this aggregate mood' that determine the market trends. And these changes are patterned.
How else to explain the fact that I can draw tramlines connecting highs (or lows), sometimes with multi-year spans. And the highs and lows line up like soldiers.
The markets have memories and are patterned. I have shown numerous examples in my posts. And I have still more today.
And that brings me to the Dow.
The Dow's moment of truth
We should not be surprised by this, since institutional money managers who are the biggest players are massively bullish.
Barrons recently published a survey showing that a whopping 70% plus are bullish or very bullish an all-time record high. That is far higher than at the previous highs in 1999 and 2007. And crucially, only a record low 7% are bearish.
Also, over 90% are bullish for the outlook for shares in the next five years.
Where are the bears?
And now from Bloomberg, I read that many central banks are, for the very first time, selling bonds and buying equities.
This is unprecedented. It's especially notable now, after a four-year massive rally that has taken the Dow from 6,500 in 2009 to the current 14,800.
So, with this background, let's look at the charts. Needless to say, I am looking for a top:

(Click on thechart for alarger version)
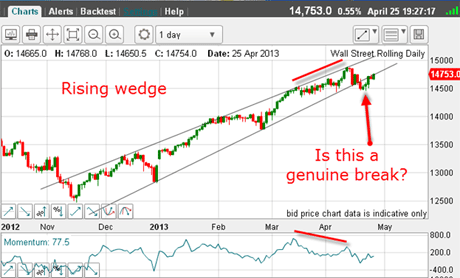
This is the updated daily chart I have shown before, depicting the rising wedge pattern. Remember, rising wedges usually resolve downwards.
And last week, the market broke below the lower line, giving the bears some hope that the long-awaited down move had started. To add to the belief, there is a large negative-momentum divergence at the high (red bars).
But, to follow the pattern of buying the dips, the market has bounced back and is currently running along the underside of the lower line.
So let's zoom in and take a closer look:

(Click on the chart for a larger version)
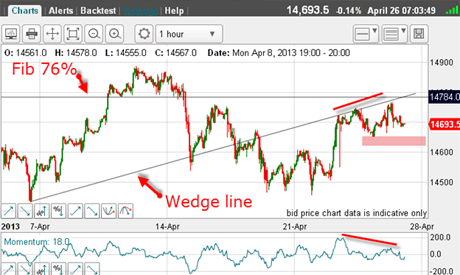
There has been much volatility this week. But last night, the market almost made it to the crucial 76% Fibonacci level of the wave down off the 14,890 high. There is also an ominous-looking negative-momentum divergence (red bars).
To my mind, we are close to the moment of truth. Either the market will poke above the wedge line, or it will make an important turn here.
And if it is making the turn here, I want to catch it! A move below the minor low (pink bar) would likely give me the signal.
Let's zoom in even closer on the 15-minute chart:

(Click on the chart for a larger version)
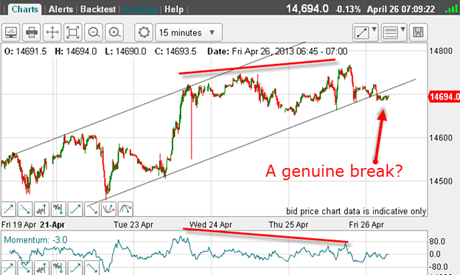
Even on this small scale, there is a negative-momentum divergence, but look at my tramlines. They are excellent with many touch points yet another illustration of markets being patterned!
As I write this morning,I have a potential tramline break. I expect this to be resolved later today, which could be a very exciting day.
If you're a new reader, or need a reminder about some of the methods I refer to in my trades, then do have a look at my introductory videos:
The essentials of tramline trading Advanced tramline trading An introduction to Elliott wave theory Advanced trading with Elliott waves Trading with Fibonacci levels Trading with 'momentum' Putting it all together
Don't miss my next trading insight. To receive all my spread betting blog posts by email, as soon as I've written them, just sign up here . If you have any queries regarding MoneyWeek Trader, please contact us here.
Get the latest financial news, insights and expert analysis from our award-winning MoneyWeek team, to help you understand what really matters when it comes to your finances.
John is is a British-born lapsed PhD physicist, who previously worked for Nasa on the Mars exploration team. He is a former commodity trading advisor with the US Commodities Futures Trading Commission, and worked in a boutique futures house in California in the 1980s.
He was a partner in one of the first futures newsletter advisory services, based in Washington DC, specialising in pork bellies and currencies. John is primarily a chart-reading trader, having cut his trading teeth in the days before PCs.
As well as his work in the financial world, he has launched, run and sold several 'real' businesses producing 'real' products.
-
 Average UK house price reaches £300,000 for first time, Halifax says
While the average house price has topped £300k, regional disparities still remain, Halifax finds.
-
 Barings Emerging Europe trust bounces back from Russia woes
Barings Emerging Europe trust has added the Middle East and Africa to its mandate, delivering a strong recovery, says Max King