Why did gold crash?
The dramatic crash in the gold price was a great example of what drives markets. But what matters most for traders, says John C Burford - is what's coming next.
Get the latest financial news, insights and expert analysis from our award-winning MoneyWeek team, to help you understand what really matters when it comes to your finances.
You are now subscribed
Your newsletter sign-up was successful
Want to add more newsletters?

Twice daily
MoneyWeek
Get the latest financial news, insights and expert analysis from our award-winning MoneyWeek team, to help you understand what really matters when it comes to your finances.

Four times a week
Look After My Bills
Sign up to our free money-saving newsletter, filled with the latest news and expert advice to help you find the best tips and deals for managing your bills. Start saving today!
th { background: #2b1083; padding: 2px 1px;color: white;font-weight: bold;text-align: center;border-left: 1px solid #a6a6c9; font-size: .8em;}
th.first { border-left: 0; padding: 2px 1px;text-align: left; font-size: .8em;}
tr {background: #fff;}
MoneyWeek
Subscribe to MoneyWeek today and get your first six magazine issues absolutely FREE

Sign up to Money Morning
Don't miss the latest investment and personal finances news, market analysis, plus money-saving tips with our free twice-daily newsletter
Don't miss the latest investment and personal finances news, market analysis, plus money-saving tips with our free twice-daily newsletter
tr.alt {background: #f6f5f9; }
td { padding: 2px 1px;text-align: center;border-left: 1px solid #a6a6c9;color: #000;vertical-align: center; font-size: .8em;}
td.alt { background-color: #f6f5f9; }
td.bold { font-weight: bold;}
td.first { text-align: left; }
td.left { text-align: left; }
td.bleft{ text-align: left; font-weight: bold; }-->Today, I will follow up on the gold market, which is still getting its fair share of coverage after the crash.
When I analyse market trends, I use them to project forward into the future. Because picking over entrails is a pointless exercise. Nobody can say with certainty whether it was central bank selling, or the sell advice of Goldman Sachs, or the sudden allure of fiat currencies that crashed the market.
The market fell through major support and hit a lot of sell-stops. That is the story.
As a trader, your focus should be on how to play these events to make money, not to ascribe a cause' to the crash. Even if such information can be discovered and that is highly doubtful what possible good can it do you in your quest for future profit? The move is over, and if you missed it, you missed it.
The hand of the market having writ, moves on. So should you. Your focus should be on doing your analysis using your usual trading methods at all times.
Most people believe that it is the economic news that moves markets. The gold bugs believed that because of historic levels of central bank money printing, that gold must increase in dollar terms.
Their logic seems impeccable and many novice traders/investors have been lured by this argument, as they foresee massive hyperinflation. But that misreads how markets work.
It was a successful belief... until September 2011, that is. Then, gold touched $1,920 and then embarked on a massive collapse down to the $1,525 area.
So what changed? Did the central banks suddenly see the error of their ways? Did we see a dramatic fall in consumer inflation into deflation? Did currencies suddenly become the big investment choice, especially for the gold bugs?
I don't think so.
What changed was the simple fact that there was a bubble when too many jumped on the buy gold' bandwagon. And then at the top area, there were not enough new buy orders to sustain the rally.
Markets are moved by the unseen herding impulses, which are unconnected to economic factors (at least at the time).
These herding impulses follow waves of sentiment in a patterned way, and these patterns are displayed on the charts, sometimes in clear Elliott waves.
At the 2011 top, bullish sentiment was off the scale. Last week, bullish sentiment was in the basement. That switch in sentiment is what drove gold lower.
Our task as traders is to stand apart from the herd and observe. Only then can we make a balanced analysis and stand a good chance of making consistent profits.
How did sentiment change?
Also last Friday, the latest commitments of traders (COT) figures were released (data as of the previous Tuesday):
| OPEN INTEREST: 413,083 | ||||||||
| COMMITMENTS | ||||||||
| 204,677 | 75,795 | 18,067 | 144,522 | 286,451 | 367,266 | 380,313 | 45,817 | 32,770 |
| CHANGES FROM04/09/13 (CHANGE IN OPEN INTEREST: -3,430) | ||||||||
| 865 | -8,658 | -5,806 | 8,667 | 6,794 | 3,726 | -7,670 | -7,156 | 4,240 |
| PERCENT OF OPEN INTEREST FOR EACH CATEGORY OF TRADERS | ||||||||
| 49.5 | 18.3 | 4.4 | 35.0 | 69.3 | 88.9 | 92.1 | 11.1 | 7.9 |
| NUMBER OF TRADERS IN EACH CATEGORY (TOTAL TRADERS: 336) | ||||||||
| 170 | 86 | 82 | 61 | 47 | 258 | 193 | Row 8 - Cell 7 | Row 8 - Cell 8 |
Naturally, with such dramatic action, I would expect to see much change in the open interest position and so I did.
The hedge funds covered many shorts for big profits, while the small specs reduced their losing longs and increased their shorts.
This is precisely what can be expected as a result of the huge swings both up and down that week. Remember, the small specs are generally the weaker holders. Those holding long positions were getting those dreaded margin calls, and some brave souls were even jumping on the short bandwagon, probably late in the day.
On balance, the hedge funds did not add to shorts that week, but were taking profits. That was the smart play, of course.
At some point in this relief rally, with the selling by stale' longs and new short selling providing pressure, the rally will run out of steam at some point.
So this week, I was on the lookout for a place to exit my long trade and reverse for a new short position.
And I had help from my tramlines!
Looking for the next trade

(Click onthe chartfor alarger version)
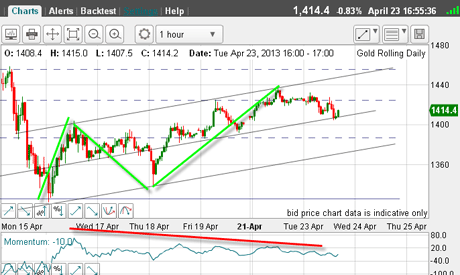
Last Friday, the market hit the 23% Fibonacci level at the $1,420 level, which I noted in my post. That certainly would have been a good place to enter a short trade.
But an even better one was on Monday, when the market almost hit the $1,440 level at the upper tramline.
I have a good A-B-C rally form (slightly different from my previous attempt) and a superb central tramline with many touch points. The upper line also is solid with a nice prior pivot point (PPP) and the three touch points.
With the huge potential negative-momentum divergence (red bar), I believed the rally was running out of steam as the market approached the upper tramline.
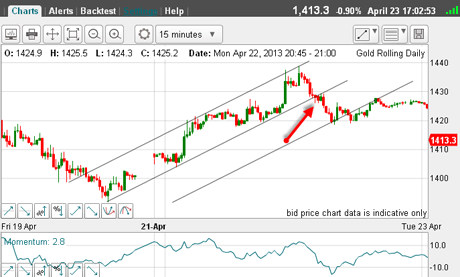
So, as the market approached the $1,440 level on Monday, I zoomed in on the 15-minute chart:

(Click on the chart for a larger version)
And lo and behold, I had a super tramline pair, complete with a PPP on the upper tramline.
That gave me huge confidence to exit my long trade and reverse to short in the $1,430 area as the lower (now centre) tramline was broken (red arrow). My protective stop was placed in the $1,435 area for a very low risk trade.
With my third (lower) tramline now in place, I could expect a decline to that line and it ran along it for some time before peeling away.
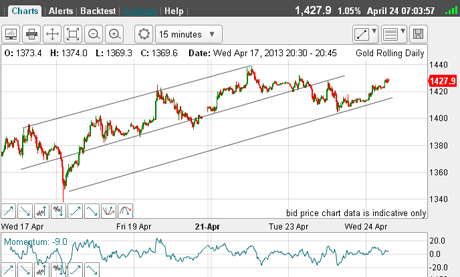
As I write this morning, here is the chart:

(Click on the chart for a larger version)
I have re-drawn my tramlines slightly, and the lower line is holding, so far.
As I noted yesterday, the $1,410 level was a good place for short-term traders to take a profit. And as I write, I see the market has moved up through my break-even stop at $1,428 to take me out for a break-even trade.
And in the tough gold market, that seems like a victory!
But I have a nice gain from my long trade, and so my overall campaign was a success.
That leaves me flat... and looking for the next trade.
If you're a new reader, or need a reminder about some of the methods I refer to in my trades, then do have a look at my introductory videos:
The essentials of tramline trading Advanced tramline trading An introduction to Elliott wave theory Advanced trading with Elliott waves Trading with Fibonacci levels Trading with 'momentum' Putting it all together
Don't miss my next trading insight. To receive all my spread betting blog posts by email, as soon as I've written them, just sign up here. If you have any queries regarding MoneyWeek Trader, please contact us here.
Get the latest financial news, insights and expert analysis from our award-winning MoneyWeek team, to help you understand what really matters when it comes to your finances.
John is is a British-born lapsed PhD physicist, who previously worked for Nasa on the Mars exploration team. He is a former commodity trading advisor with the US Commodities Futures Trading Commission, and worked in a boutique futures house in California in the 1980s.
He was a partner in one of the first futures newsletter advisory services, based in Washington DC, specialising in pork bellies and currencies. John is primarily a chart-reading trader, having cut his trading teeth in the days before PCs.
As well as his work in the financial world, he has launched, run and sold several 'real' businesses producing 'real' products.
-
 Pension Credit: should the mixed-age couples rule be scrapped?
The mixed-age couples rule was introduced in May 2019 to reserve pension credit for older households but a charity warns it is unfair
-
 Average income tax by area: The parts of the UK paying the most tax mapped
The UK’s total income tax bill was £240.7 billion 2022/23, but the tax burden is not spread equally around the country. We look at the towns and boroughs that have the highest average income tax bill.