Get the latest financial news, insights and expert analysis from our award-winning MoneyWeek team, to help you understand what really matters when it comes to your finances.
You are now subscribed
Your newsletter sign-up was successful
Want to add more newsletters?

Twice daily
MoneyWeek
Get the latest financial news, insights and expert analysis from our award-winning MoneyWeek team, to help you understand what really matters when it comes to your finances.

Four times a week
Look After My Bills
Sign up to our free money-saving newsletter, filled with the latest news and expert advice to help you find the best tips and deals for managing your bills. Start saving today!
Welcome back.
This week, we’re looking at renewable energy. It’s all the rage – and that, perhaps, is the problem. It might be the future of power generation, but right now, it’s getting expensive to invest in, says John. Nevertheless, “cleantech” is not something that’s going away. And whatever type of green energy prevails, it’s going to be built on metal – lots of metal, with lithium and copper chief among them. And that bodes well for Latin America. James McKeigue looks at how you can buy in.
This week’s podcast sees Merryn joined by Simon French of Panmure Gordon. He’s got a bit of a contrarian take on inflation. As you may be aware, we’re pretty much of the view that we’re likely to be seeing some sustained inflation coming our way. Simon, however, thinks it will just be a short-term phenomenon as we recover from lockdowns. He tells Merryn why – listen to the podcast here.
MoneyWeek
Subscribe to MoneyWeek today and get your first six magazine issues absolutely FREE

Sign up to Money Morning
Don't miss the latest investment and personal finances news, market analysis, plus money-saving tips with our free twice-daily newsletter
Don't miss the latest investment and personal finances news, market analysis, plus money-saving tips with our free twice-daily newsletter
This week’s “Too Embarrassed To Ask” looks at “gearing” – also known as leverage. It’s another of those complicated-sounding terms which describes a very simple concept – and one that is very important in investing. Find out more here.
Here are the links for this week’s editions of Money Morning and other web stories you may have missed.
- Monday Money Morning: Bitcoin’s crash wasn’t about Elon or China – it was about inflation
- Web article: How rising Covid cases in Asia spell higher inflation in the US
- Tuesday Money Morning: Why we’ll all be better off when the commodities curse is dispelled
- Merryn’s blog: Why an ageing population is not necessarily the disaster many people think it is
- Web article: Elon Musk brings some joy to bitcoin hodlers, but will it last?
- Wednesday Money Morning: Bitcoin is in a bear market. So what should hodlers do now?
- Web article: Is Marks & Spencer finally starting to turn around?
- Thursday Money Morning: Central banks are starting to raise rates – what does that mean for your money?
- Friday Money Morning: Big oil is under pressure to cut production – what does that mean for investors?
Now for the charts of the week.
The charts that matter
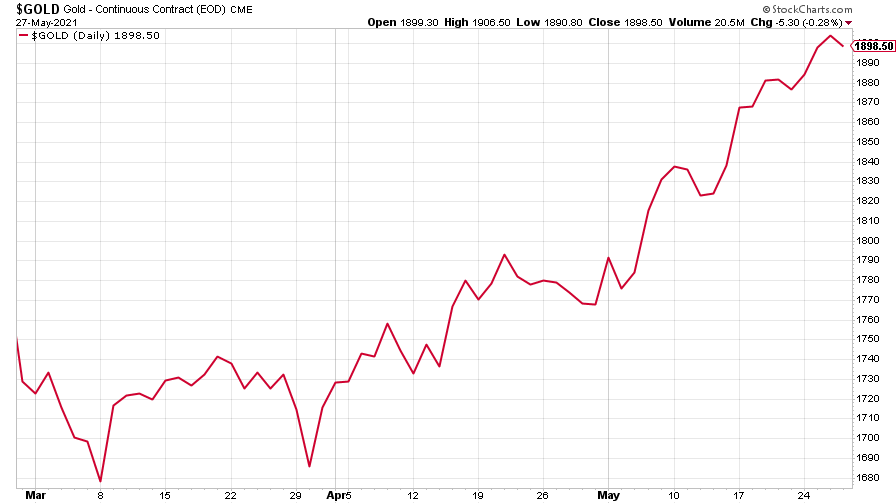
Gold kept on climbing. It’s still a long way off its peak, but it’s pretty much back where it started the year.
(Gold: three months)
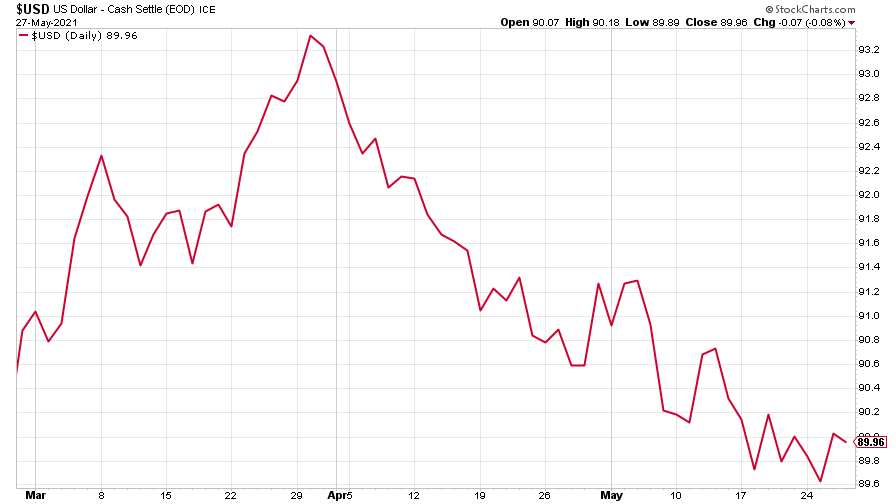
The US dollar index (DXY – a measure of the strength of the dollar against a basket of the currencies of its major trading partners) just keeps on falling.
(DXY: three months)
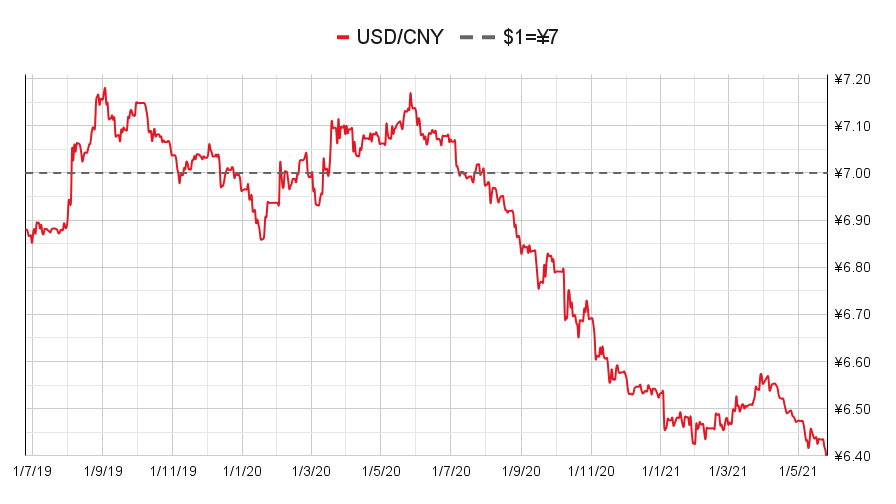
While the Chinese yuan (or renminbi) is getting stronger (when the red line is rising, the dollar is strengthening while the yuan is weakening).
(Chinese yuan to the US dollar: since 25 Jun 2019)
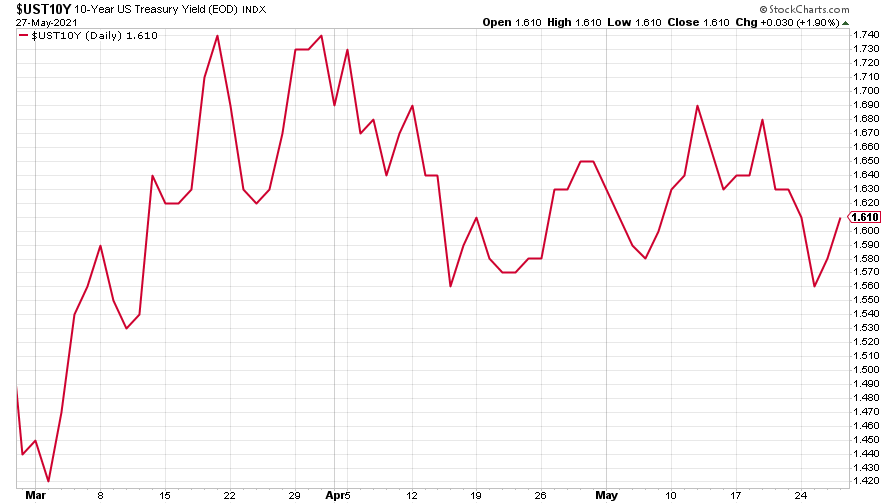
The yield on the ten-year US government bond is treading water.
(Ten-year US Treasury yield: three months)
The yield on the Japanese ten-year bond seems to be drifting down after looking like it might perk up last week.
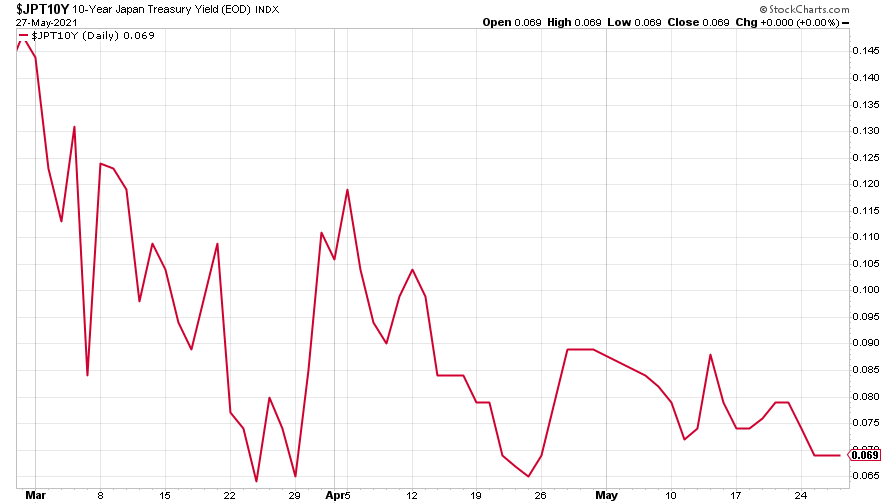
(Ten-year Japanese government bond yield: three months)
And the yield on the ten-year German Bund, dropped suddenly, after a couple of months of solid rises.
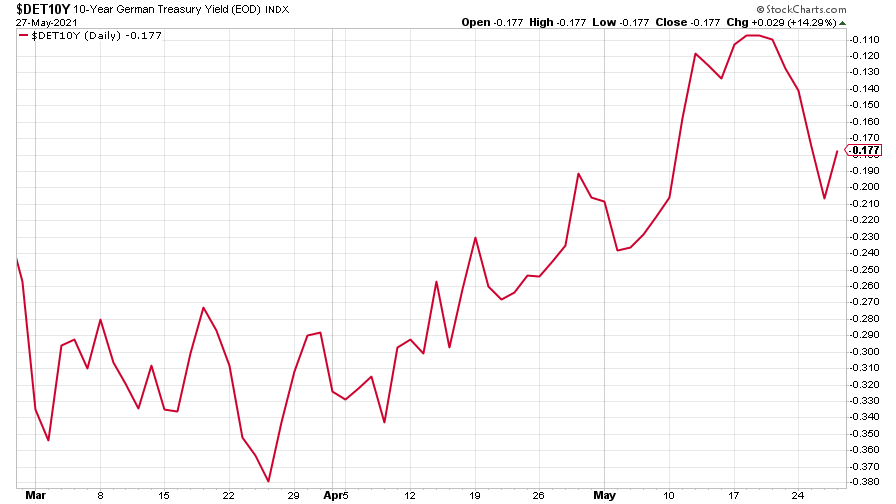
(Ten-year Bund yield: three months)
Copper paused for breath, but it’s still in demand.
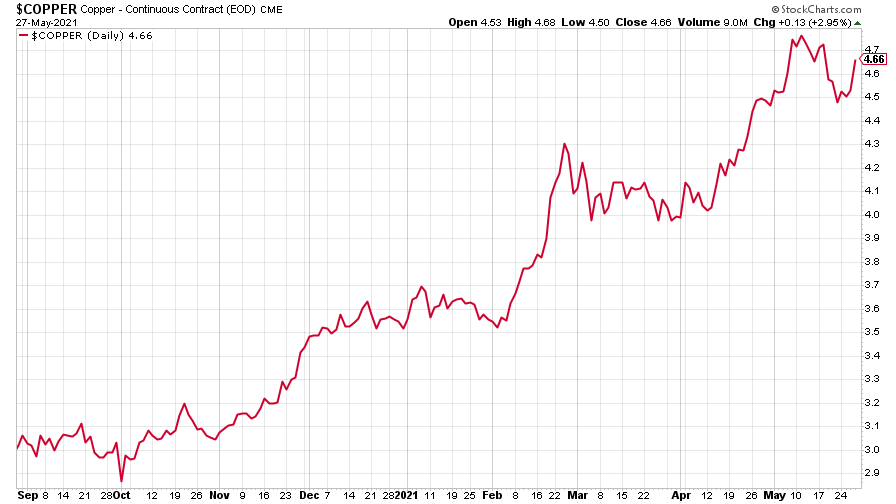
(Copper: nine months)
The closely-related Aussie dollar continued its volatile sideways drift.
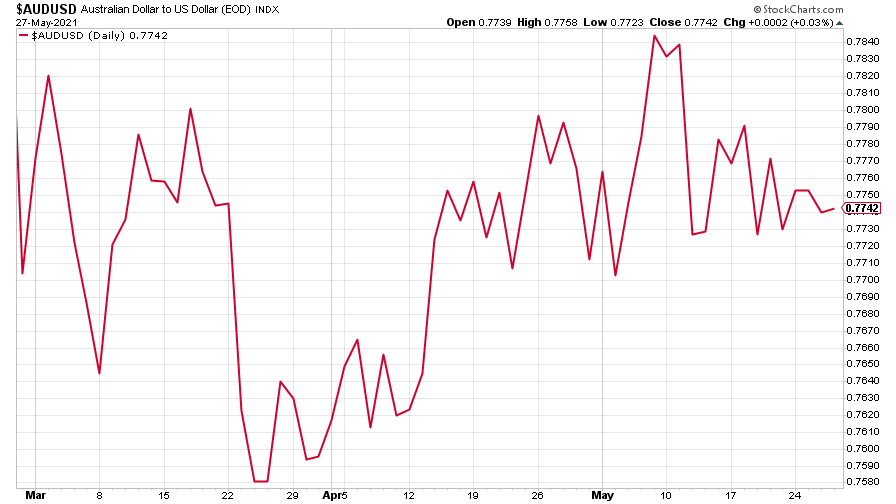
(Aussie dollar vs US dollar exchange rate: three months)
And bitcoin failed to immediately bounce back from its huge selloff the previous week. It stabilised a little, but where it goes next is anyone’s guess, says Dominic.
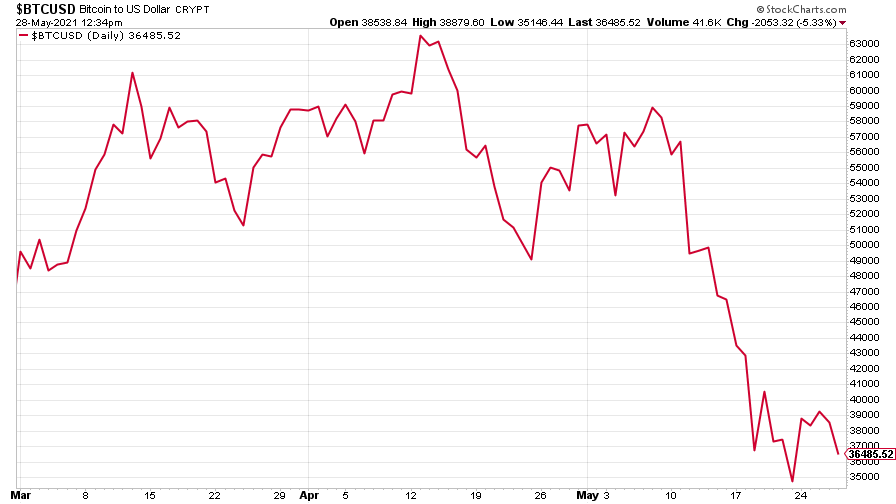
(Bitcoin: three months)
US weekly initial jobless claims continued to fall, down 38,000 to 406,000, compared to 444,000 last week. The four-week moving average fell to 458,750, down 46,000 from 504,750 the week before.
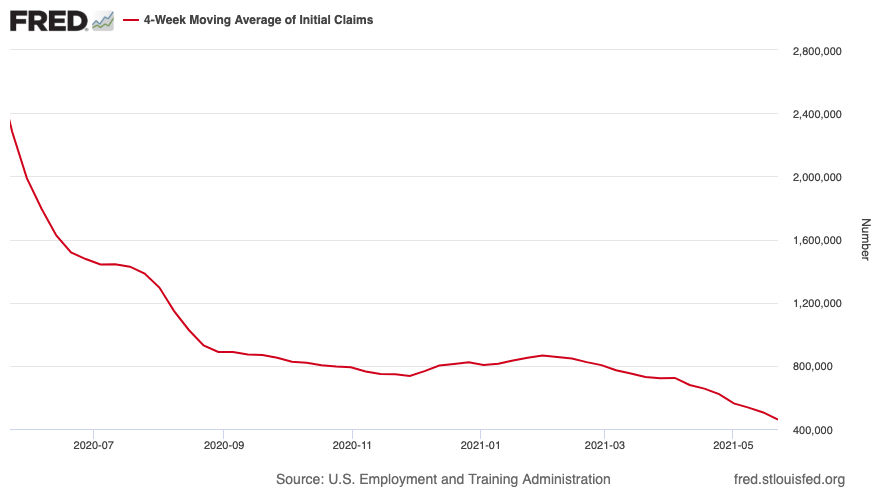
(US initial jobless claims, four-week moving average: since Jan 2020)
The oil price recovered from its previous week’s drop.
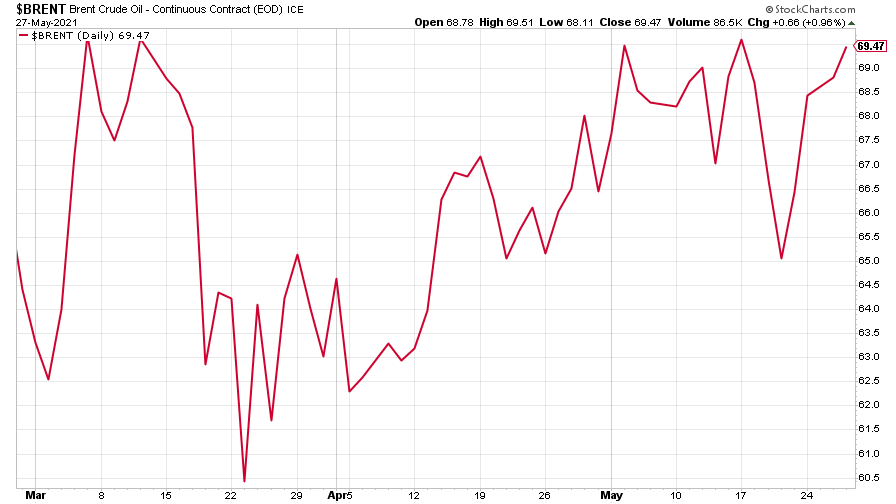
(Brent crude oil: three months)
Amazon is trading sideways.
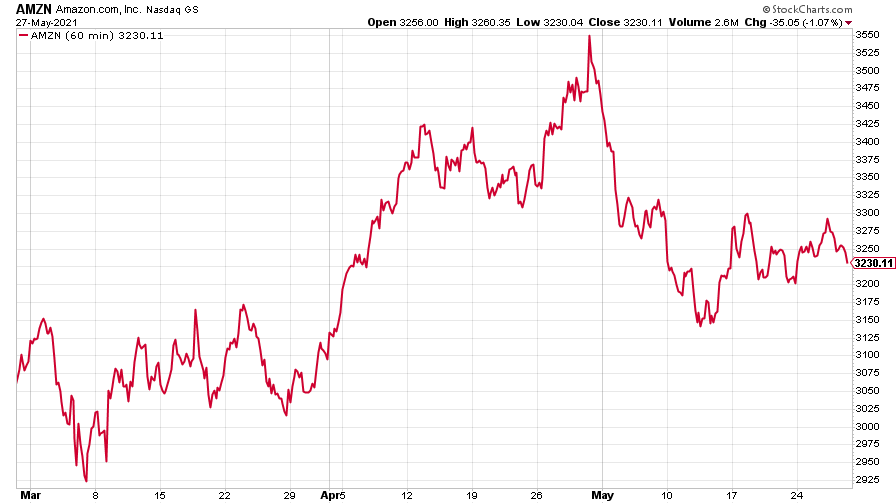
(Amazon: three months)
And Tesla made something of a recovery.
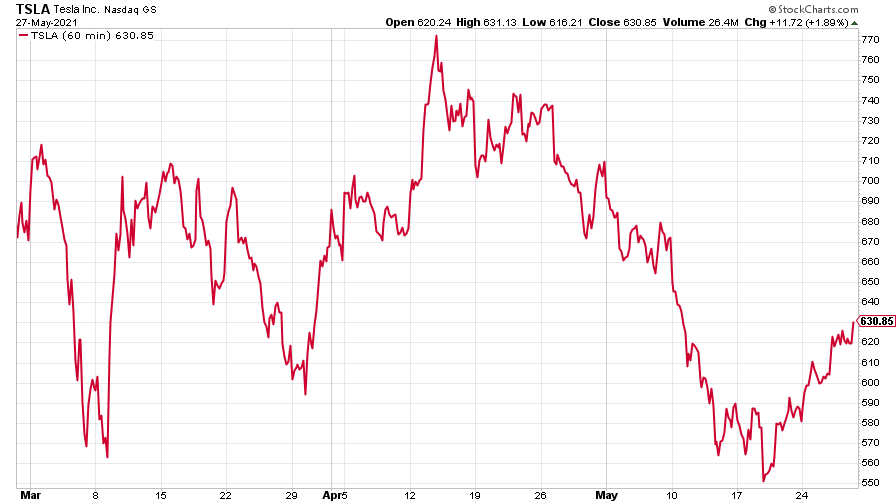
(Tesla: three months)
Have a great weekend.
Ben
Get the latest financial news, insights and expert analysis from our award-winning MoneyWeek team, to help you understand what really matters when it comes to your finances.

-
 How should a good Catholic invest? Like the Vatican’s new stock index, it seems
The Vatican Bank has launched its first-ever stock index, championing companies that align with “Catholic principles”. But how well would it perform?
-
 The most single-friendly areas to buy a property
There can be a single premium when it comes to getting on the property ladder but Zoopla has identified parts of the UK that remain affordable if you aren’t coupled-up
-
 UK wages grow at a record pace
The latest UK wages data will add pressure on the BoE to push interest rates even higher.
-
 Trapped in a time of zombie government
It’s not just companies that are eking out an existence, says Max King. The state is in the twilight zone too.
-
 America is in deep denial over debt
The downgrade in America’s credit rating was much criticised by the US government, says Alex Rankine. But was it a long time coming?
-
 UK economy avoids stagnation with surprise growth
Gross domestic product increased by 0.2% in the second quarter and by 0.5% in June
-
 Bank of England raises interest rates to 5.25%
The Bank has hiked rates from 5% to 5.25%, marking the 14th increase in a row. We explain what it means for savers and homeowners - and whether more rate rises are on the horizon
-
 UK inflation remains at 8.7% ‒ what it means for your money
Inflation was unmoved at 8.7% in the 12 months to May. What does this ‘sticky’ rate of inflation mean for your money?
-
 Would a food price cap actually work?
Analysis The government is discussing plans to cap the prices of essentials. But could this intervention do more harm than good?
-
 Is my pay keeping up with inflation?
Analysis High inflation means take home pay is being eroded in real terms. An online calculator reveals the pay rise you need to match the rising cost of living - and how much worse off you are without it.
