Get the latest financial news, insights and expert analysis from our award-winning MoneyWeek team, to help you understand what really matters when it comes to your finances.
You are now subscribed
Your newsletter sign-up was successful
Want to add more newsletters?

Twice daily
MoneyWeek
Get the latest financial news, insights and expert analysis from our award-winning MoneyWeek team, to help you understand what really matters when it comes to your finances.

Four times a week
Look After My Bills
Sign up to our free money-saving newsletter, filled with the latest news and expert advice to help you find the best tips and deals for managing your bills. Start saving today!
Welcome back.
This week’s MoneyWeek magazine casts its eye over the Greensill affair, with a briefing on just how big a problem political lobbying is. Our main investment feature, however, is on the “new agricultural revolution” – the rise of lab-grown meat. We look at the current state of the technology, and pick some of the best stocks and funds to buy to get in on the trend, while MoneyWeek regular contributor and entrepreneur Jim Mellon gives his take on the sector.
Merryn’s back on podcast duties. This week she talks to Peter Spiller of the Capital Gearing Trust – one which I’m sure many of you hold. They have a fascinating and wide-ranging chat that covers investing through the pandemic, plus inflation, financial repression, gold, bitcoin and property. Listen to what Peter’s got to say here. And for those who prefer it, we’re now including a transcript below the podcast.
MoneyWeek
Subscribe to MoneyWeek today and get your first six magazine issues absolutely FREE

Sign up to Money Morning
Don't miss the latest investment and personal finances news, market analysis, plus money-saving tips with our free twice-daily newsletter
Don't miss the latest investment and personal finances news, market analysis, plus money-saving tips with our free twice-daily newsletter
This week’s “Too Embarrassed To Ask” video takes a look at inflation, too, explaining the difference between two of the most important indicators – “producer price inflation” and “consumer price inflation”. Watch that here.
Here are the links for this week’s editions of Money Morning and other web stories you may have missed.
- Monday Money Morning: Why all eyes will be on US inflation data this week
- Tuesday Money Morning: Yes, NFTs are a bubble. But like many bubbles of the past, they will change everything
- Web article: What’s in Biden’s global corporation tax proposals?
- Wednesday Money Morning: US inflation is rising – but it’s not enough to rattle markets yet
- Web article: Coinbase, America’s largest crypto exchange, is going public. Should you invest?
- Thursday Money Morning: What does the Coinbase listing mean for bitcoin and other cryptocurrencies?
- Friday Money Morning: Why China’s bad bank has some investors rattled
- Web article: What’s behind New Zealand’s runaway house prices?
Now for the charts of the week.
The charts that matter
Gold continued to claw some ground back. As so often happens, this occurred just as investors appeared to be starting to give up on the yellow metal. A combination of bond yields dipping back (which means interest rates going down) plus very strong economic data in the US (which hints at a more inflationary future) helped, as gold generally does well when real interest rates (rates adjusted for inflation) are falling.
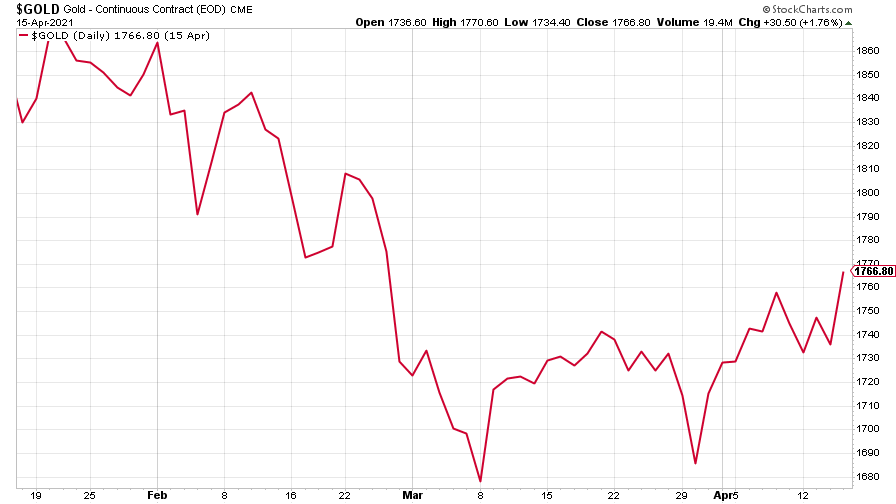
(Gold: three months)
The US dollar index (DXY – a measure of the strength of the dollar against a basket of the currencies of its major trading partners) continued its recent slide lower, quite possibly because strong US data is boosting risk appetite (investors are more inclined to leave the safety of the dollar for more risky climes when times look good, which means that – a little counter-intuitively – strong economic data in the US doesn’t always result in a stronger US dollar).
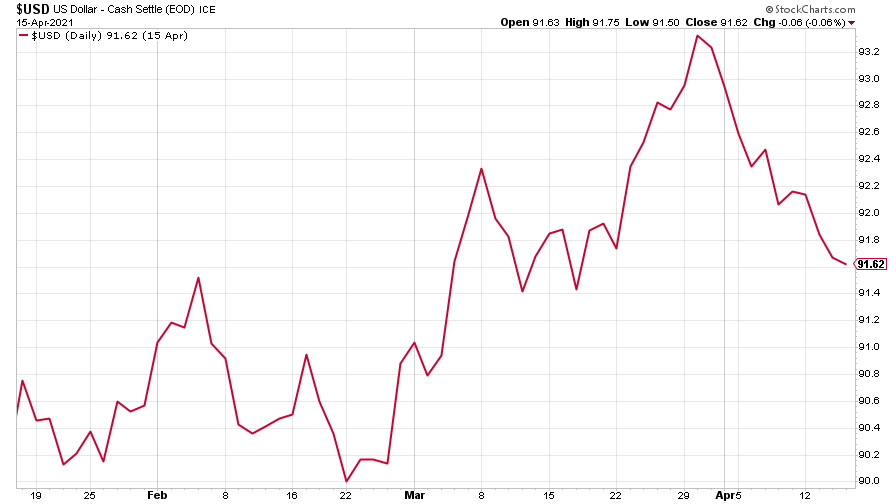
(DXY: three months)
However, the dollar’s weakness did not extend to the Chinese yuan (or renminbi) – when the red line is rising, the dollar is strengthening while the yuan is weakening. This is quite possibly because of jitters in the Chinese bond market.
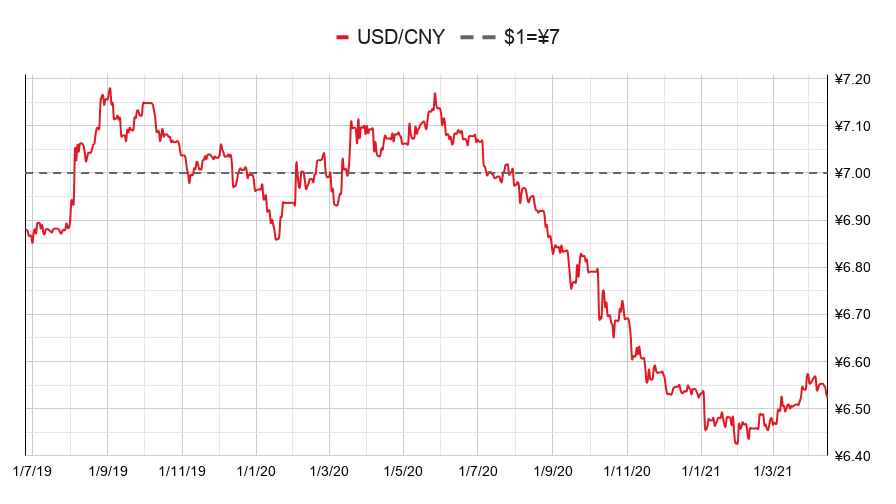
(Chinese yuan to the US dollar: since 25 Jun 2019)
The yield on the ten-year US government bond downward drift continued despite recent strong data. The bond market may simply need time to digest the recent move.
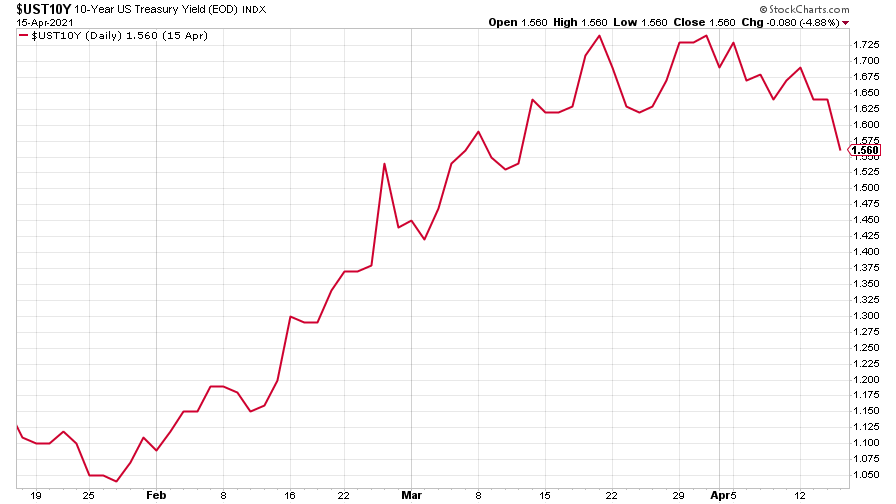
(Ten-year US Treasury yield: three months)
The yield on the Japanese ten-year bond was also lower.
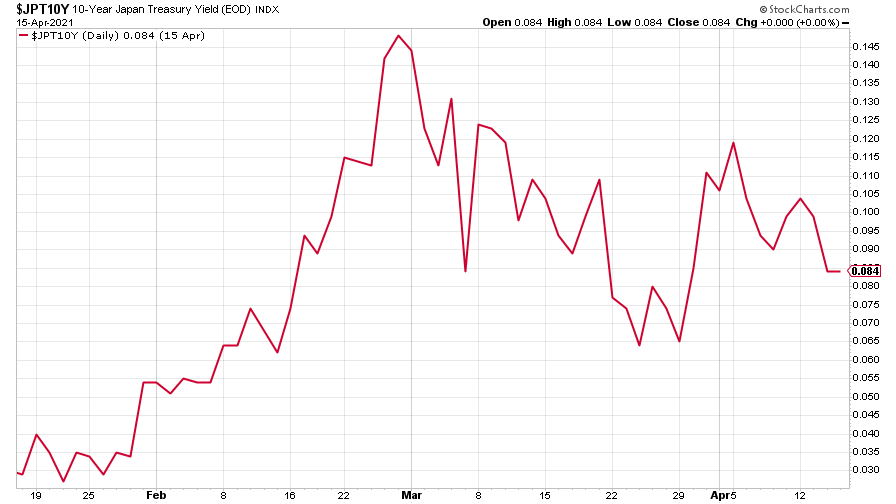
(Ten-year Japanese government bond yield: three months)
While the yield on the ten-year German Bund perked up a little, but remains negative.
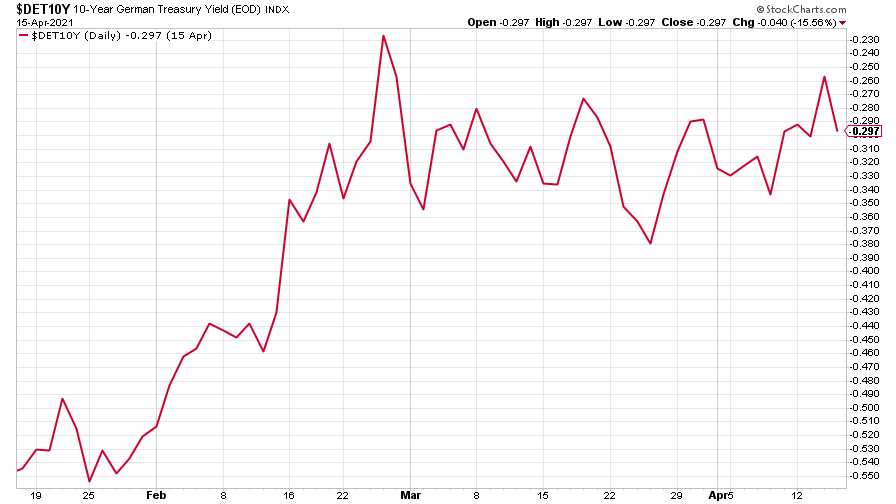
(Ten-year Bund yield: three months)
Copper was also in a more positive mood, although it’s still below its recent peak.
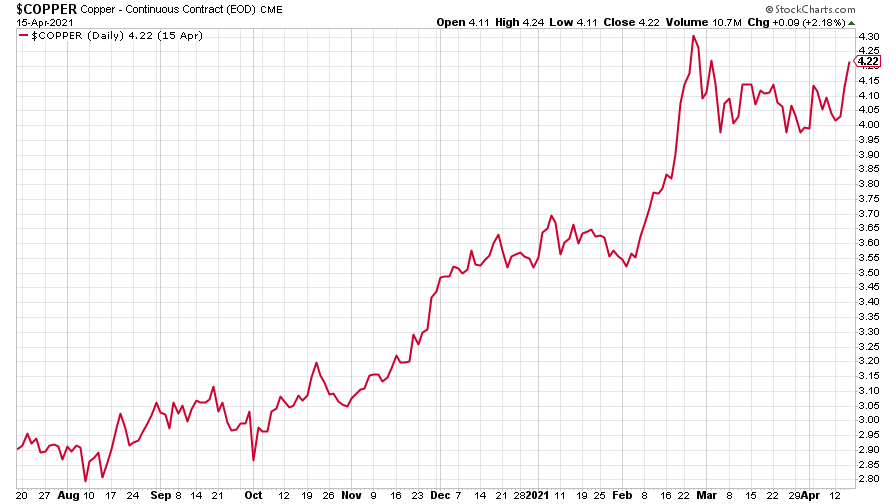
(Copper: nine months)
And the closely-related Aussie dollar took courage from a rising copper price and rallied sharply against the weakening US dollar.
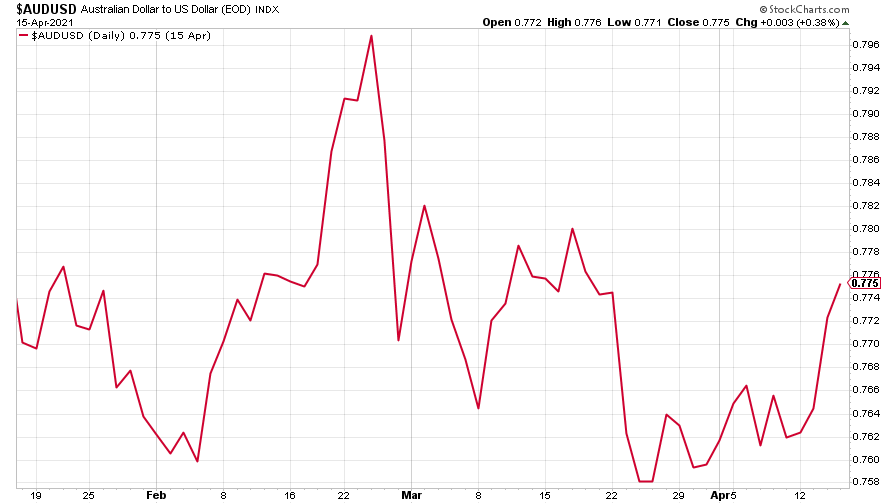
(Aussie dollar vs US dollar exchange rate: three months)
Cryptocurrency bitcoin hit yet another record high this week, but slackened off towards the end of the week as Coinbase went public.
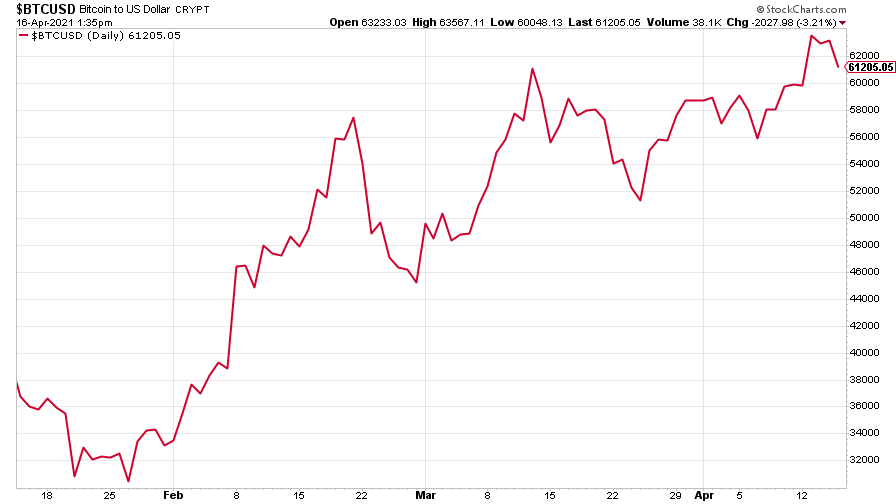
(Bitcoin: three months)
US weekly initial jobless claims slid by 193,000 to 576,000, compared to 769,000 last week (revised up from 744,000). It’s the lowest number of claims since March 2020. The four-week moving average fell to 683,000, down 47,250 from 730,250 (which was revised up from 723,750) the week before.
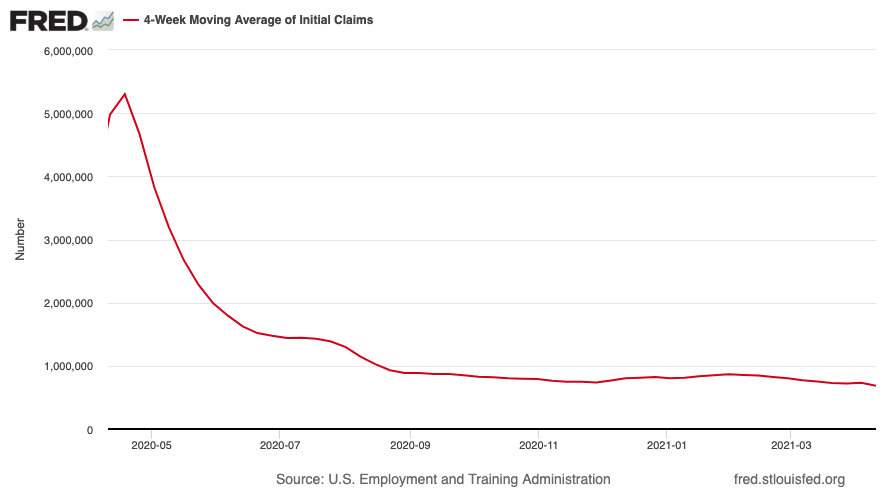
(US initial jobless claims, four-week moving average: since Jan 2020)
The oil price took another big jump after drifting for a while.
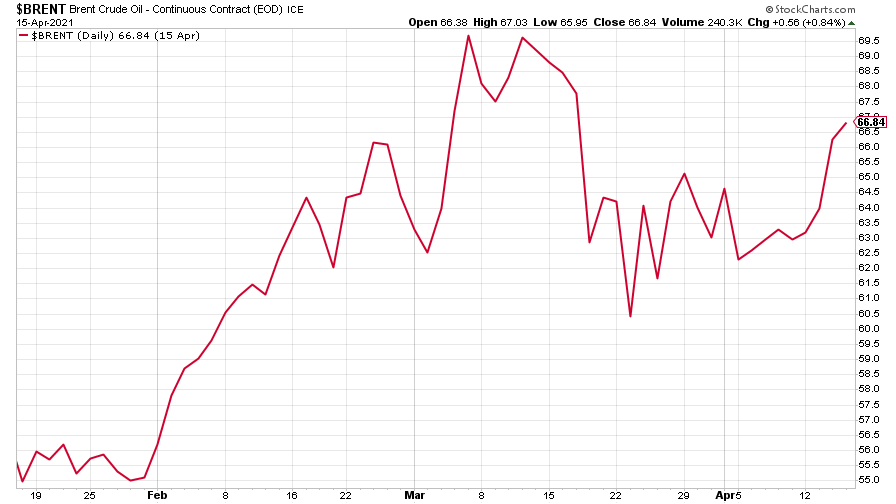
(Brent crude oil: three months)
Amazon built on last week’s gains before correcting a little. But it seems investors’ appetite for big tech is not quite done yet.
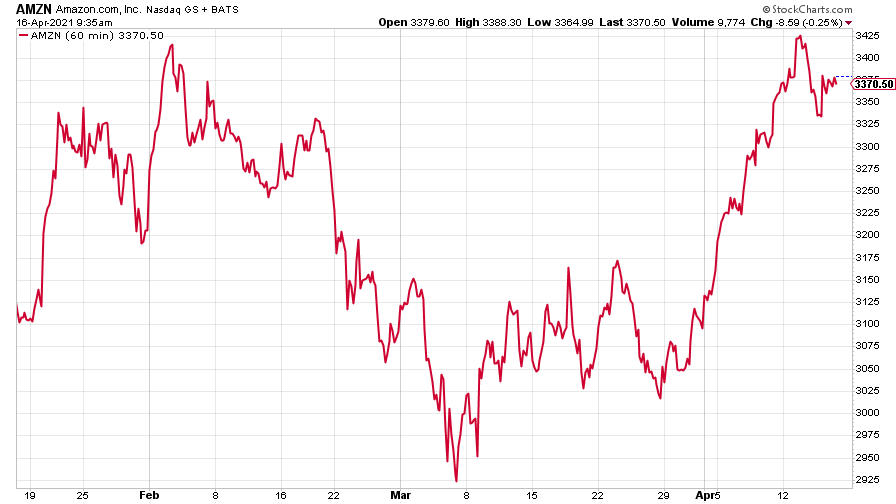
(Amazon: three months)
And Tesla also saw some decent gains.
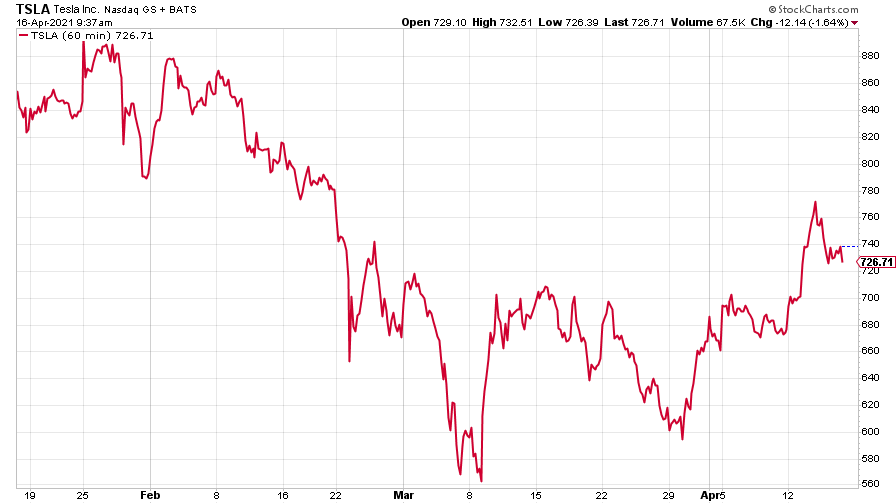
(Tesla: three months)
Have a great weekend.
Get the latest financial news, insights and expert analysis from our award-winning MoneyWeek team, to help you understand what really matters when it comes to your finances.

-
 Can mining stocks deliver golden gains?
With gold and silver prices having outperformed the stock markets last year, mining stocks can be an effective, if volatile, means of gaining exposure
-
 8 ways the ‘sandwich generation’ can protect wealth
People squeezed between caring for ageing parents and adult children or younger grandchildren – known as the ‘sandwich generation’ – are at risk of neglecting their own financial planning. Here’s how to protect yourself and your loved ones’ wealth.
-
 UK wages grow at a record pace
The latest UK wages data will add pressure on the BoE to push interest rates even higher.
-
 Trapped in a time of zombie government
It’s not just companies that are eking out an existence, says Max King. The state is in the twilight zone too.
-
 America is in deep denial over debt
The downgrade in America’s credit rating was much criticised by the US government, says Alex Rankine. But was it a long time coming?
-
 UK economy avoids stagnation with surprise growth
Gross domestic product increased by 0.2% in the second quarter and by 0.5% in June
-
 Bank of England raises interest rates to 5.25%
The Bank has hiked rates from 5% to 5.25%, marking the 14th increase in a row. We explain what it means for savers and homeowners - and whether more rate rises are on the horizon
-
 UK inflation remains at 8.7% ‒ what it means for your money
Inflation was unmoved at 8.7% in the 12 months to May. What does this ‘sticky’ rate of inflation mean for your money?
-
 Would a food price cap actually work?
Analysis The government is discussing plans to cap the prices of essentials. But could this intervention do more harm than good?
-
 Is my pay keeping up with inflation?
Analysis High inflation means take home pay is being eroded in real terms. An online calculator reveals the pay rise you need to match the rising cost of living - and how much worse off you are without it.
