Get the latest financial news, insights and expert analysis from our award-winning MoneyWeek team, to help you understand what really matters when it comes to your finances.
You are now subscribed
Your newsletter sign-up was successful
Want to add more newsletters?

Twice daily
MoneyWeek
Get the latest financial news, insights and expert analysis from our award-winning MoneyWeek team, to help you understand what really matters when it comes to your finances.

Four times a week
Look After My Bills
Sign up to our free money-saving newsletter, filled with the latest news and expert advice to help you find the best tips and deals for managing your bills. Start saving today!
Welcome back.
This week, we dive into the vaccine wars, with Matthew Lynn explaining the harm they’ll do to everyone. On a related theme, Dr Mike Tubbs looks at the business of making scientific instruments and picks his favourite stocks in this essential sector. And Charlie Morris outlines the case for holding not just boring old-fashioned gold, but bitcoin too - the new “digital store of value” that’s exciting so many people.
A while ago, Merryn interviewed Charles Plowden of Baillie Gifford about how he invests. The webinar was shown live to registered users on Baillie Gifford’s site, but we’ve got hold of a copy of it and added it to the MoneyWeek site – if you didn’t see it at the time, take a look at it here. We’ve got more video goodness that you’ll definitely want to watch next week, too – so keep your eyes peeled.
MoneyWeek
Subscribe to MoneyWeek today and get your first six magazine issues absolutely FREE

Sign up to Money Morning
Don't miss the latest investment and personal finances news, market analysis, plus money-saving tips with our free twice-daily newsletter
Don't miss the latest investment and personal finances news, market analysis, plus money-saving tips with our free twice-daily newsletter
And this week’s “Too Embarrassed To Ask” video explores the concept of voting rights that come with (most) company shares. You can watch the video here.
And in the podcast, Merryn talks to Laura Destribats of Goldman Sachs Asset Management about investing in stocks that benefit from the behaviour and spending patterns of millennials. Have a listen to that here.
Here are the links for this week’s editions of Money Morning and other web stories you may have missed.
- Monday: Here’s why inflation will take off after the pandemic
- Monday web article: The Turkish lira crashed this morning. What’s going on?
- Merryn’s Blog: Why the Deliveroo IPO is good for shareholder democracy
- Tuesday: Why are house prices so high? And what could make them more affordable?
- Wednesday: The inflation narrative has got overheated for now – but it’s inevitable
- Thursday: Will Tesla hit $3,000, or are you better off investing elsewhere?
- Thursday web article: Efforts to refloat grounded Suez Canal container ship enter third day
- Friday: There’s a big boat wedged in the Suez Canal. How will that affect the global economy?
- Friday web article: House price rise slows – but not by much
Now for the charts of the week.
The charts that matter
Gold continues to bide its time, treading water till inflation takes off and it comes into its own. (For more on that, see Charlie’s article in the latest issue of MoneyWeek).
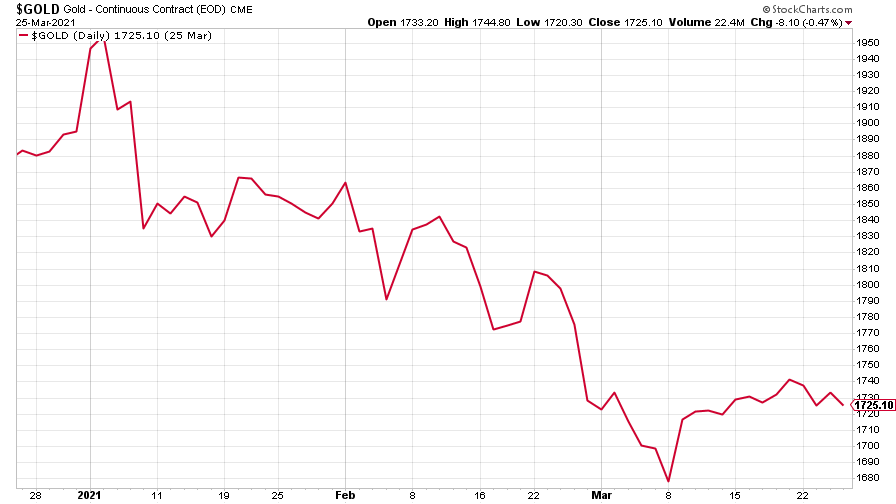
(Gold: three months)
The US dollar index (DXY – a measure of the strength of the dollar against a basket of the currencies of its major trading partners) shot up to its highest point of the year so far.
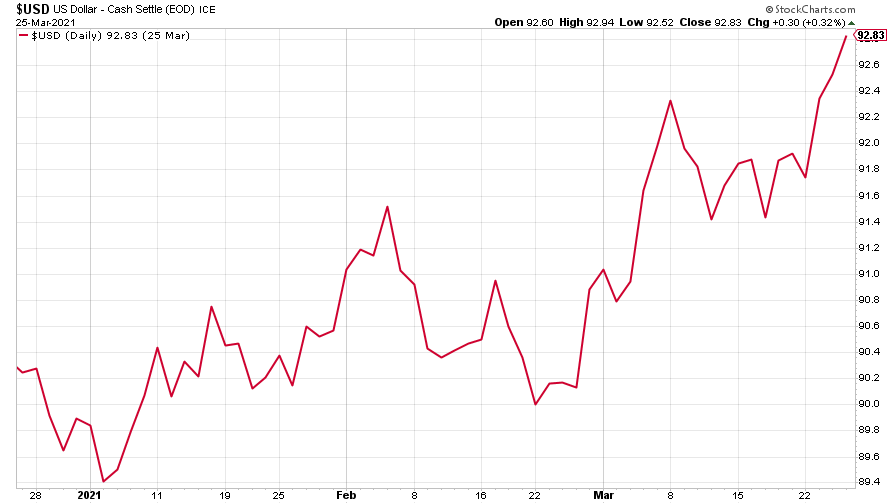
(DXY: three months)
The Chinese yuan (or renminbi) saw little change, continuing to get slowly weaker against the US dollar (when the red line is falling, the yuan is strengthening).
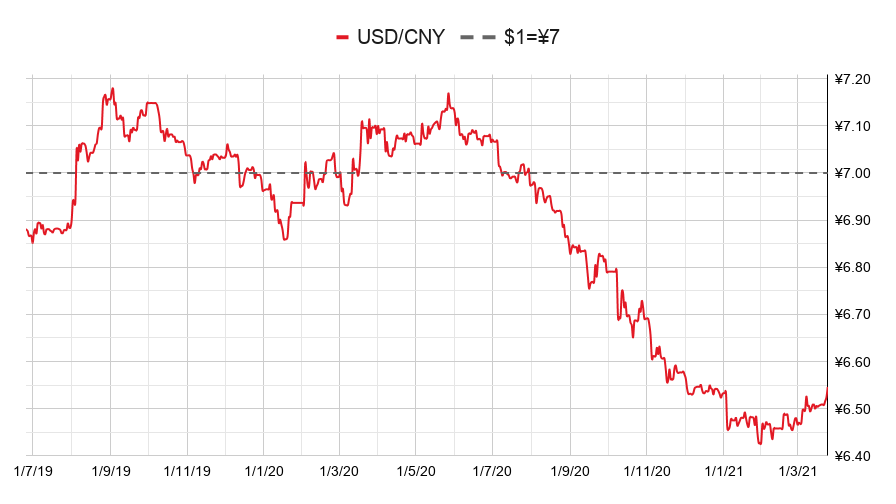
(Chinese yuan to the US dollar: since 25 Jun 2019)
The yield on the ten-year US government bond slipped back from its recent high, as investors fretted that the recovery won’t be quite as rapid as expected.

(Ten-year US Treasury yield: three months)
The yield on the Japanese ten-year bond fell further, but regained a little ground at the end of the week.
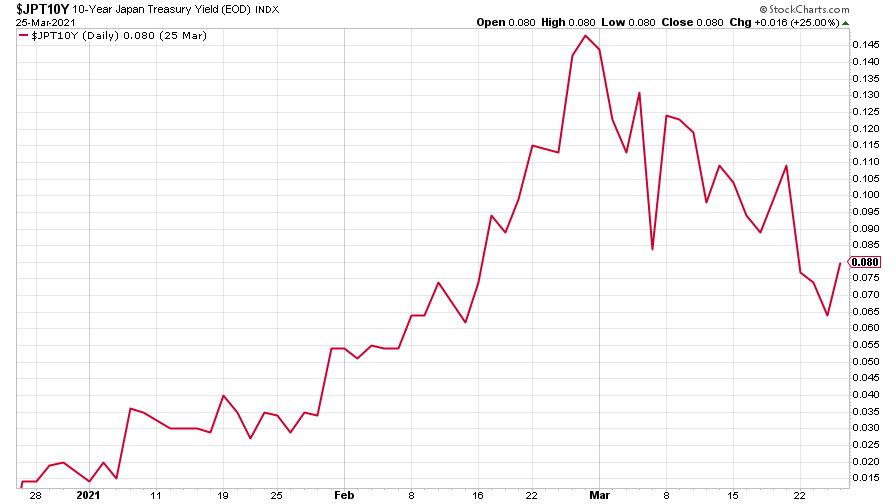
(Ten-year Japanese government bond yield: three months)
And the yield on the ten-year German Bund fell back, too, with lockdowns tightening up again across Europe.
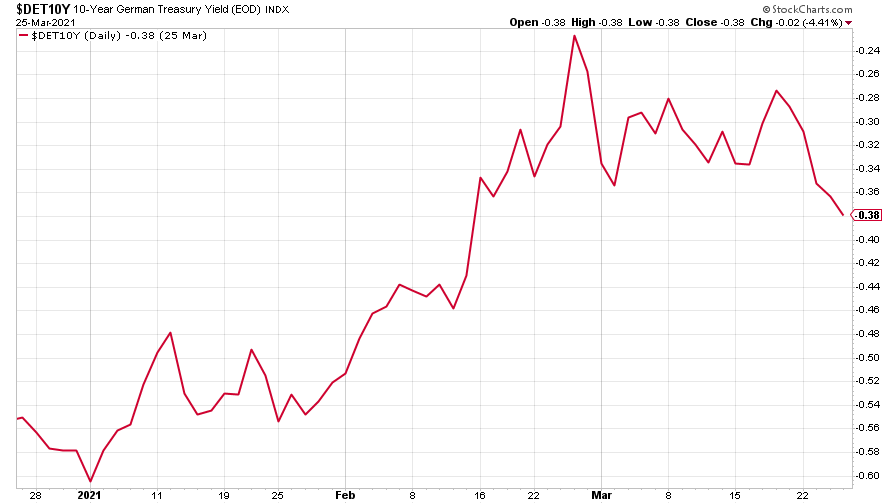
(Ten-year Bund yield: three months)
Copper’s consolidation phase turned into a drop.
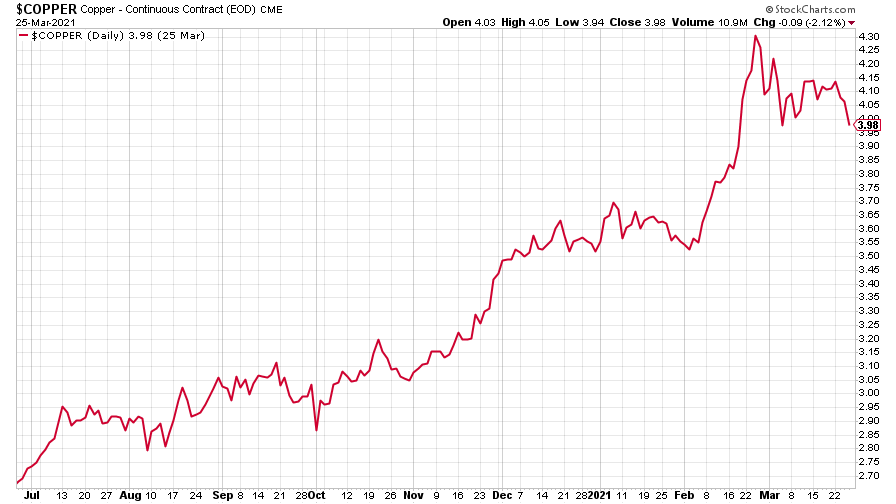
(Copper: nine months)
And the closely-related Aussie dollar took a big dive to its lowest point in three months.
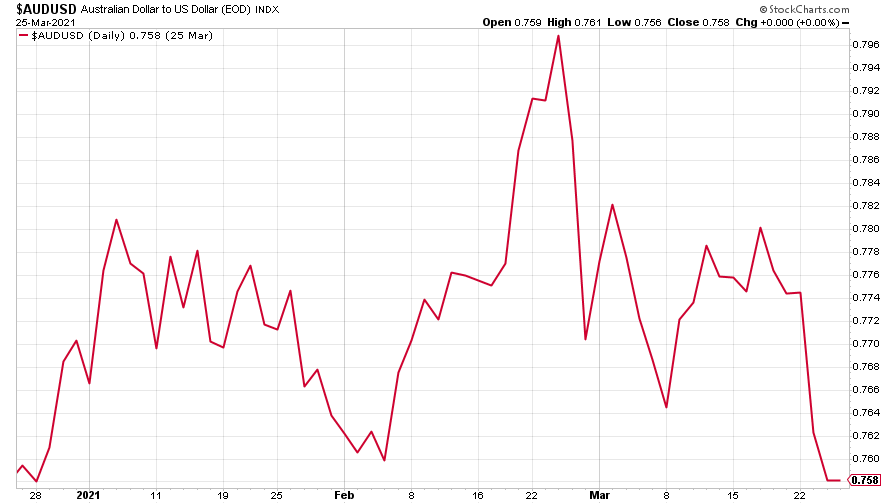
(Aussie dollar vs US dollar exchange rate: three months)
Cryptocurrency bitcoin sold off again. The start of a bigger fall or just another pause till it’s back into orbit?
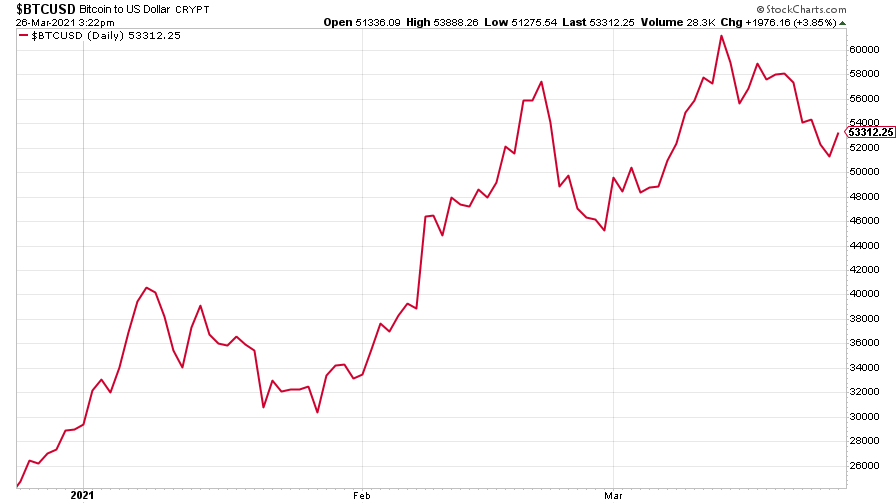
(Bitcoin: three months)
US weekly initial jobless claims slid by 97,000 to 684,000, compared to 781,000 last week (revised up from 770,000). The four-week moving average fell to 736,000, down 13,000 from 749,000 (which was revised up from 746.250) the week before.
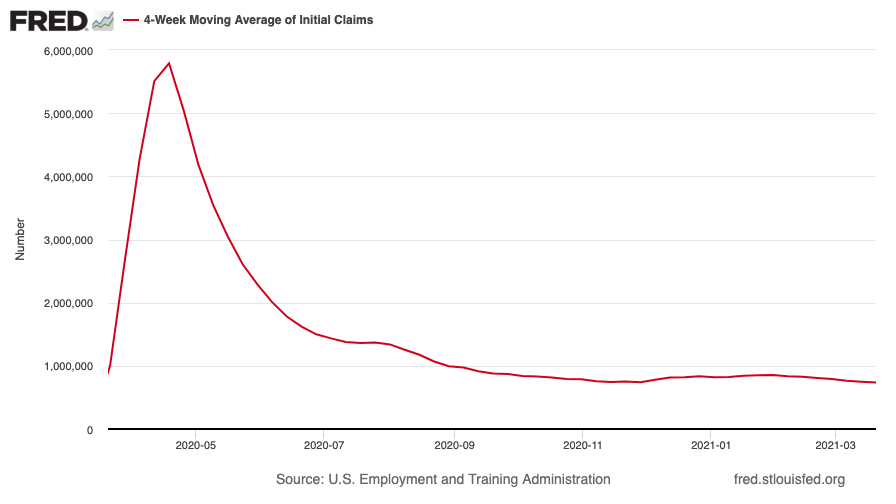
(US initial jobless claims, four-week moving average: since Jan 2020)
The oil price steadied – in a wobbly way – after its big fall the previous week. If the Suez Canal blockage doesn’t get shifted soon, though, who knows where it could go?
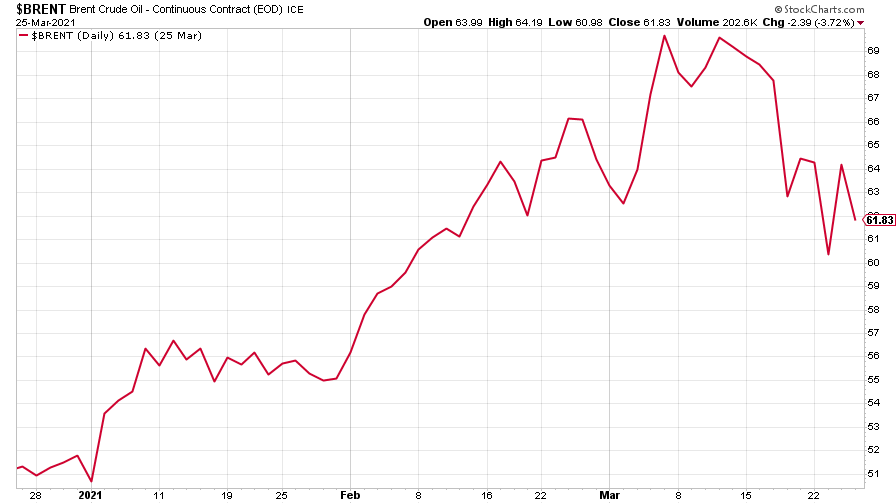
(Brent crude oil: three months)
Amazon – along with the wider tech-heavy Nasdaq index – bounced, then thought better of it and slid back to where it was last week.
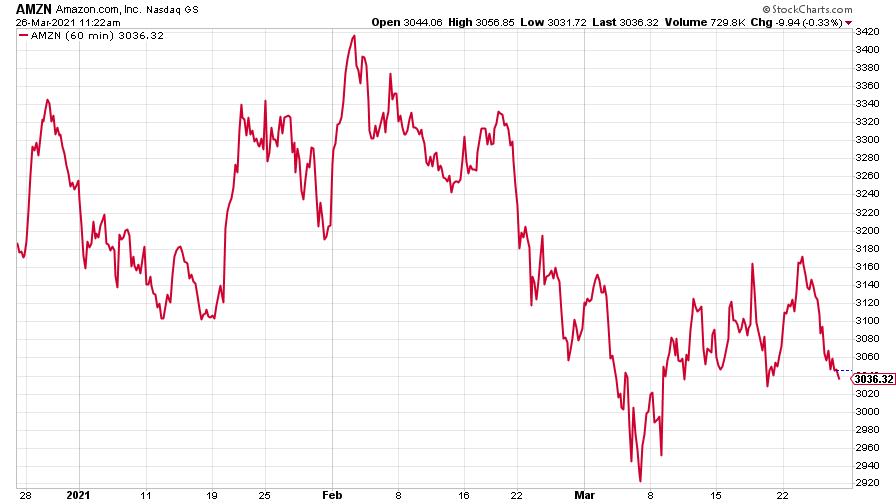
(Amazon: three months)
Tesla’s bounce, however, was followed by a bigger dip. Could the electric carmaker’s bubble be bursting? Or is it, as one fund manager has it, just pausing on its way to $3,000?
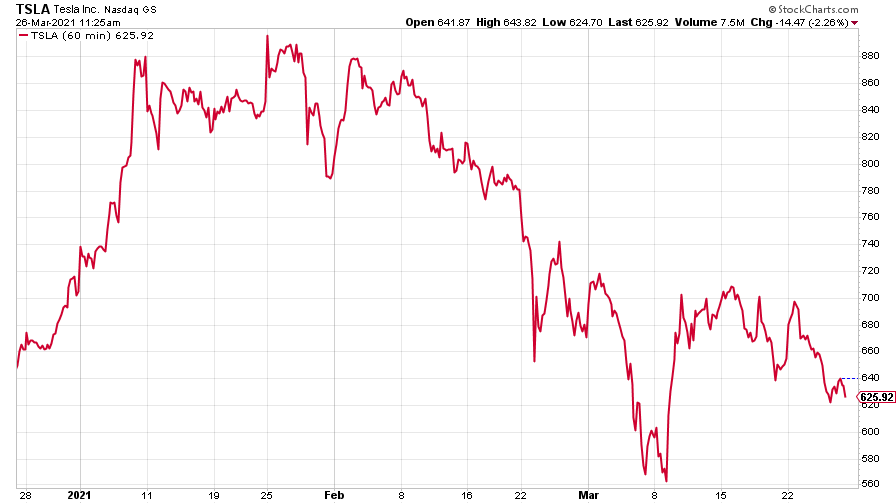
(Tesla: three months)
Have a great weekend.
Ben
Get the latest financial news, insights and expert analysis from our award-winning MoneyWeek team, to help you understand what really matters when it comes to your finances.

-
 Average UK house price reaches £300,000 for first time, Halifax says
While the average house price has topped £300k, regional disparities still remain, Halifax finds.
-
 Barings Emerging Europe trust bounces back from Russia woes
Barings Emerging Europe trust has added the Middle East and Africa to its mandate, delivering a strong recovery, says Max King
-
 UK wages grow at a record pace
The latest UK wages data will add pressure on the BoE to push interest rates even higher.
-
 Trapped in a time of zombie government
It’s not just companies that are eking out an existence, says Max King. The state is in the twilight zone too.
-
 America is in deep denial over debt
The downgrade in America’s credit rating was much criticised by the US government, says Alex Rankine. But was it a long time coming?
-
 UK economy avoids stagnation with surprise growth
Gross domestic product increased by 0.2% in the second quarter and by 0.5% in June
-
 Bank of England raises interest rates to 5.25%
The Bank has hiked rates from 5% to 5.25%, marking the 14th increase in a row. We explain what it means for savers and homeowners - and whether more rate rises are on the horizon
-
 UK inflation remains at 8.7% ‒ what it means for your money
Inflation was unmoved at 8.7% in the 12 months to May. What does this ‘sticky’ rate of inflation mean for your money?
-
 Would a food price cap actually work?
Analysis The government is discussing plans to cap the prices of essentials. But could this intervention do more harm than good?
-
 Is my pay keeping up with inflation?
Analysis High inflation means take home pay is being eroded in real terms. An online calculator reveals the pay rise you need to match the rising cost of living - and how much worse off you are without it.
