Get the latest financial news, insights and expert analysis from our award-winning MoneyWeek team, to help you understand what really matters when it comes to your finances.
You are now subscribed
Your newsletter sign-up was successful
Want to add more newsletters?

Twice daily
MoneyWeek
Get the latest financial news, insights and expert analysis from our award-winning MoneyWeek team, to help you understand what really matters when it comes to your finances.

Four times a week
Look After My Bills
Sign up to our free money-saving newsletter, filled with the latest news and expert advice to help you find the best tips and deals for managing your bills. Start saving today!
Welcome back.
In this week’s issue of the magazine, John and Merryn cast their expert eyes over the “recovery Budget”, looking at the measures the chancellor laid out to get the economy back on its feet and asking: who’s going to pay for it all? Dominic delves into the prospects for tin – an often overlooked but vital metal, and picks the best ways to invest. And Max King picks some attractively-priced trusts in the commercial property sector. If you’re not already a subscriber, sign up now and get your first six mags (plus a beginner’s guide to bitcoin) free.
Our latest “Too Embarrassed To Ask” video looks at “fiscal drag”, as used to great effect by Rishi Sunak in this week’s Budget. Find out more about it in our video here.
MoneyWeek
Subscribe to MoneyWeek today and get your first six magazine issues absolutely FREE

Sign up to Money Morning
Don't miss the latest investment and personal finances news, market analysis, plus money-saving tips with our free twice-daily newsletter
Don't miss the latest investment and personal finances news, market analysis, plus money-saving tips with our free twice-daily newsletter
In our podcast this week Merryn is back, talking to Nick Purves and Ian Lance of the Temple Bar Investment Trust, which has seen a remarkable turnaround in fortunes this year. They talk about the shift away from tech-heavy growth stocks into old economy value stocks, and point out that the UK market hasn’t been this cheap compared to world markets for something like 50 years. Have a listen to what they’ve got to say here.
Here are the links for this week’s editions of Money Morning and other web stories you may have missed.
- Monday: What is “yield curve control” and why is it coming to a central bank near you?
- Merryn’s blog: Why the classic 60/40 investment portfolio may no longer work
- Bitcoin: A beginner’s guide to bitcoin: what is bitcoin?
- Tuesday: What to watch out for in Budget 2021
- Wednesday: Why gold has been such a bad investment so far this year
- Thursday: What the recovery Budget means for your money
- More budget: Furlough extension, corporation tax and green investment – the main points of the Budget
- Yet more budget: Why the Budget means house prices are likely to continue higher this year
- Friday: The great rotation is firmly underway – what does it mean for you?
Now for the charts of the week.
The charts that matter
Gold carried on tumbling. It’s now down over $250 from its high at the start of the year. Dominic went into the reasons why in Wednesday’s Money Morning – read it here if you missed it.
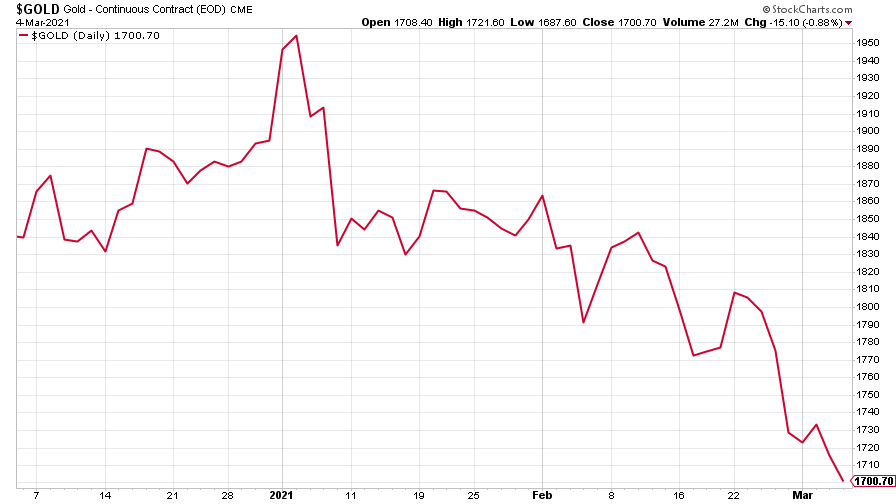
(Gold: three months)
The US dollar index (DXY – a measure of the strength of the dollar against a basket of the currencies of its major trading partners) shot back up, reacting to Federal Reserve chief Jerome Powell’s lack of alacrity when it came to wading in to calm the bond market.
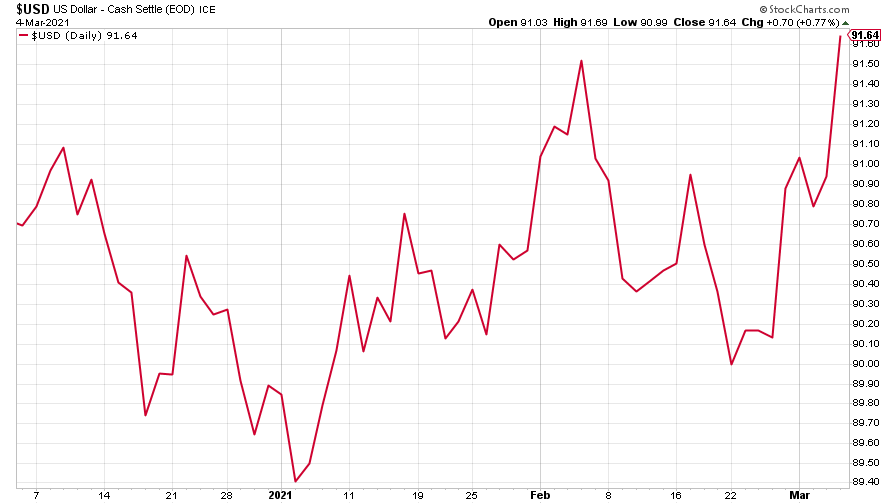
(DXY: three months)
The Chinese yuan (or renminbi) saw little change, as it continues to trade in a range against the US dollar (when the red line is falling, the yuan is strengthening).
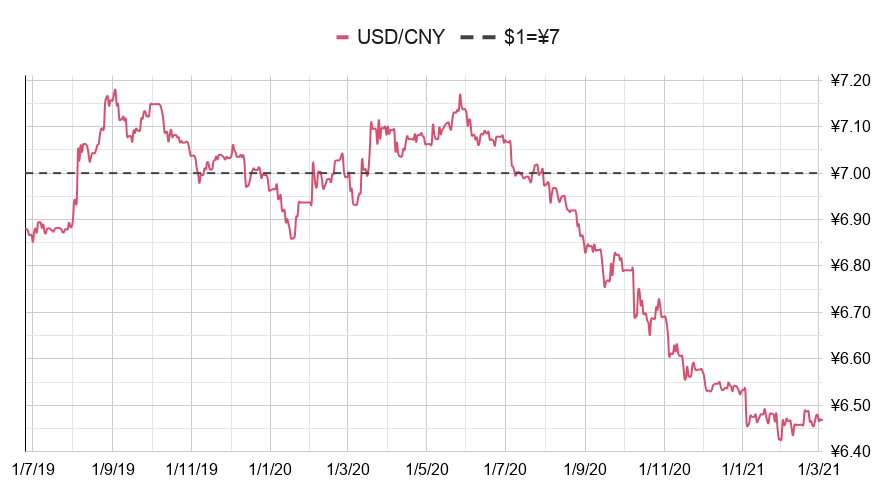
(Chinese yuan to the US dollar: since 25 Jun 2019)
The yield on the ten-year US government bond hit a ten-year high after the latest US monthly jobs report came in a lot stronger than expected.
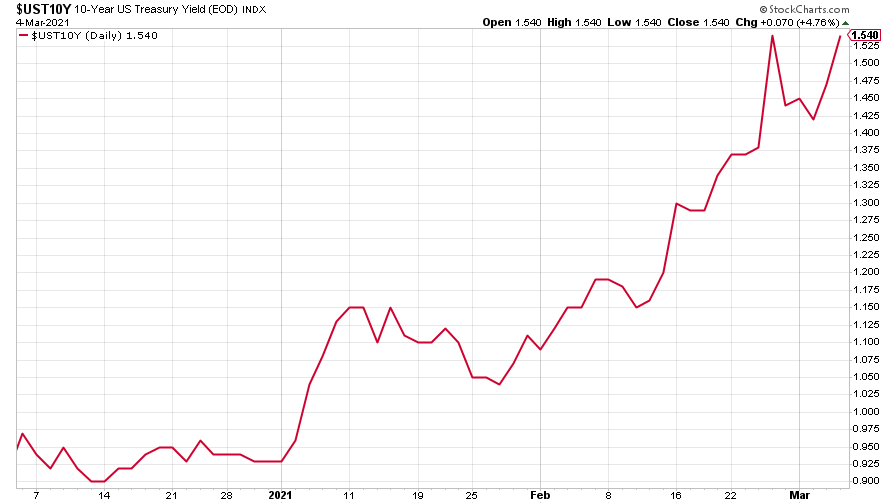
(Ten-year US Treasury yield: three months)
The yield on the Japanese ten-year bond retrenched a little, after topping out last week at its highest level since late 2019.
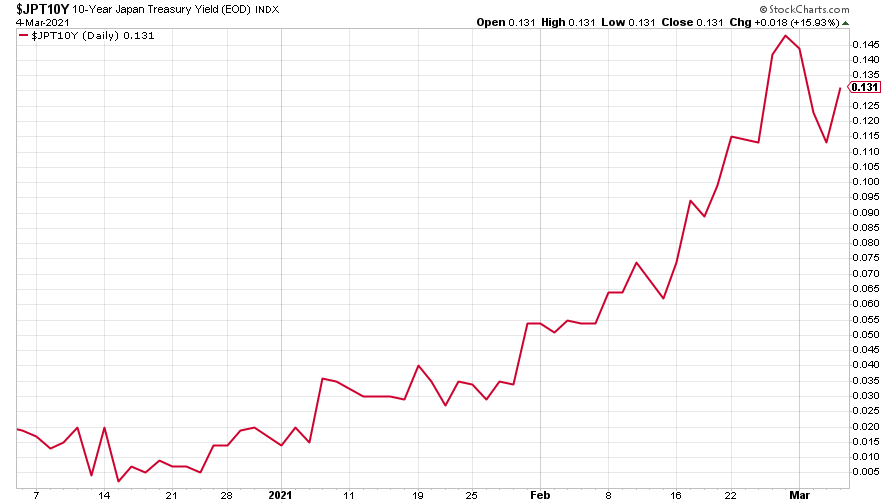
(Ten-year Japanese government bond yield: three months)
The yield on the ten-year German Bund also dropped back.
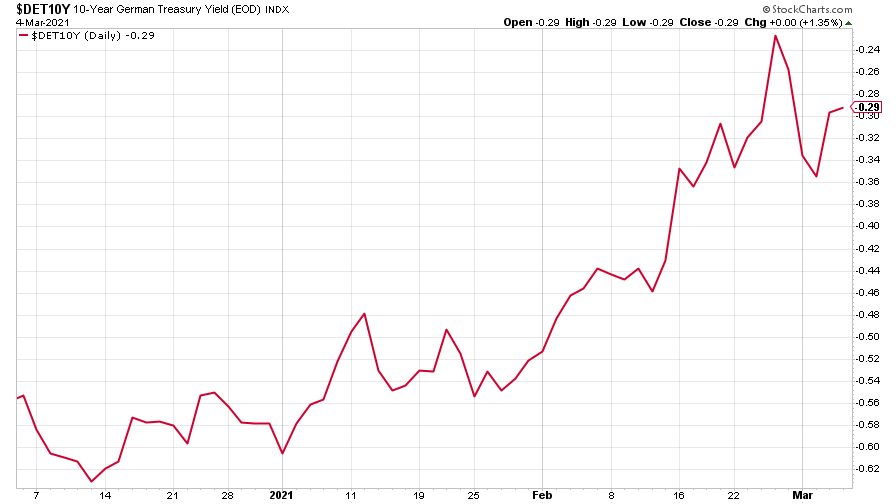
(Ten-year Bund yield: three months)
Copper plunged after hitting a nine-year high. But it’s had a spectacular run over the last nine months and as a vital component of the electrified future, may only be pausing for breath.
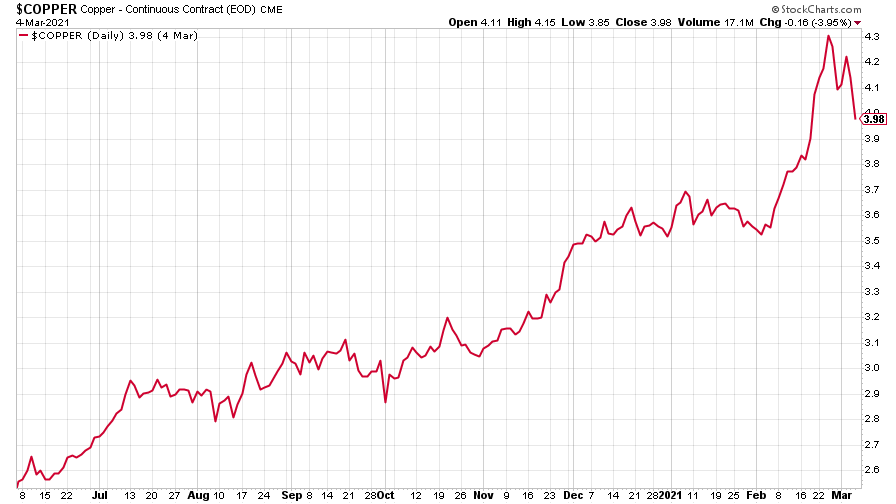
(Copper: nine months)
The Aussie dollar fell back in sympathy with the copper price.
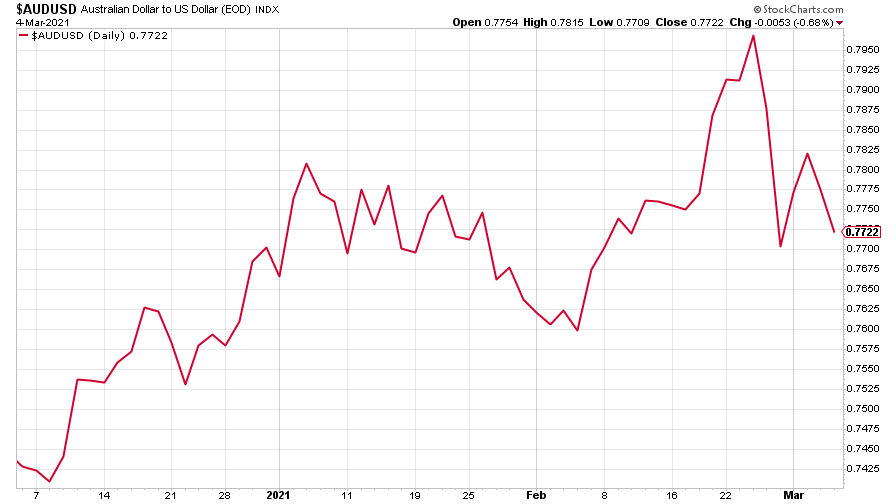
(Aussie dollar vs US dollar exchange rate: three months)
Cryptocurrency bitcoin steadied itself after last week’s big selloff.
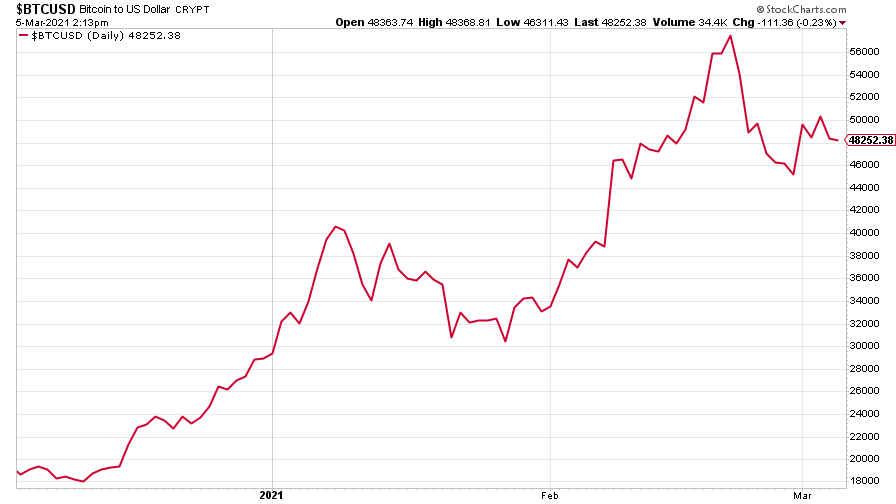
(Bitcoin: three months)
US weekly jobless claims rose by 9,000 to 745,000, compared to 736,000 last week (revised up from 730,000). The four-week moving average fell to 790,750 from 807,500 (which was revised down from 807,750) the week before. The Fed’s Jerome Powell was positive, however, saying on Thursday that there was “good reason to expect job creation to pick up in the coming months.”
Meanwhile on Friday, the latest nonfarm payrolls came out and revealed that the US economy had added a lot more jobs than expected in February. There were 379,000 jobs added to payrolls, with the vast majority of those restaurant and leisure industry jobs, helped by the gradual reopening of the economy. Figures for January were also revised higher.
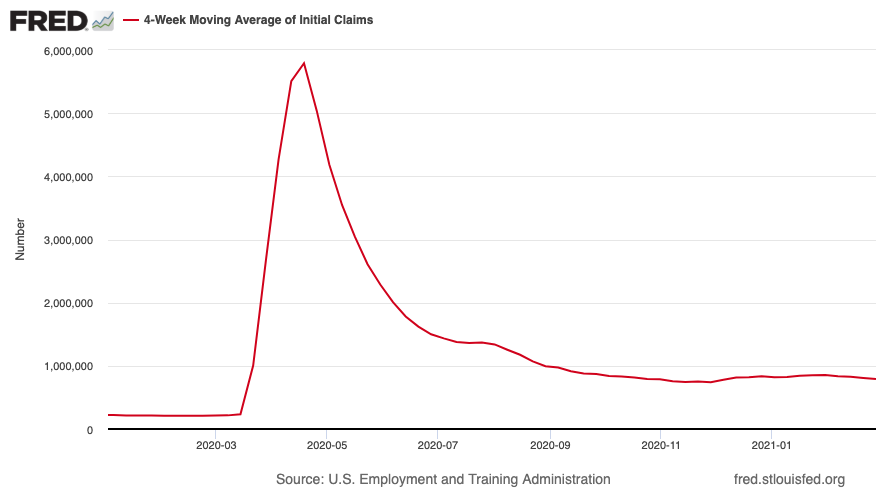
(US jobless claims, four-week moving average: since Jan 2020)
The oil price (as measured by Brent crude) surged even higher this week after a brief wobble, as Saudi Arabia and Russia resisted the temptation to increase production. People may also be starting to wake up to the fact that we’ll still be needing it for many years to come, no matter how many new electric cars hit the road.
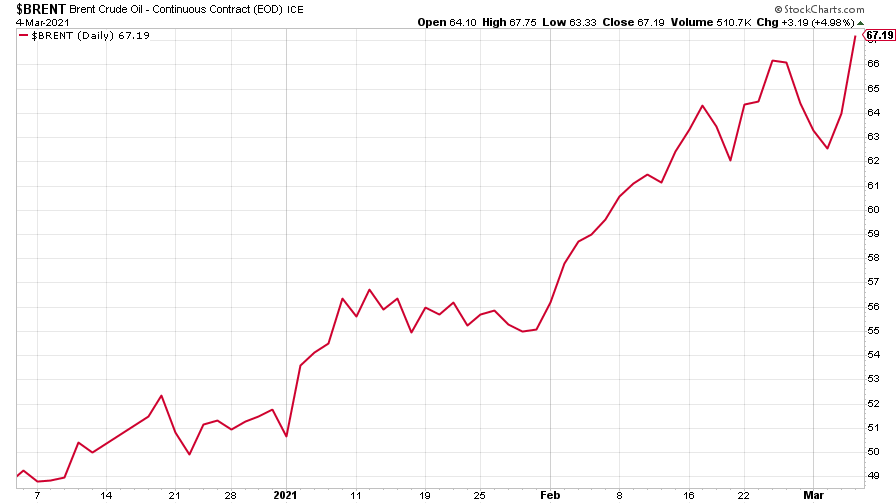
(Brent crude oil: three months)
Amazon continued its sharp fall as tech stocks sold off in a big way, with the Nasdaq index entering official “correction” territory.
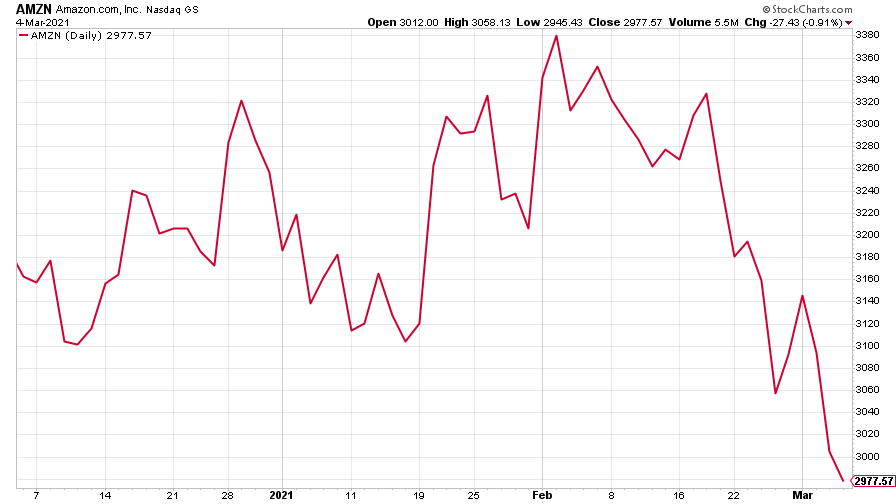
(Amazon: three months)
Tesla did the same, only even more spectacularly than Amazon. Tesla itself is now in a “bear market” – a drop of more than 20% from the most recent high – though that sort of volatility is not exactly unheard-of for the electric car maker.
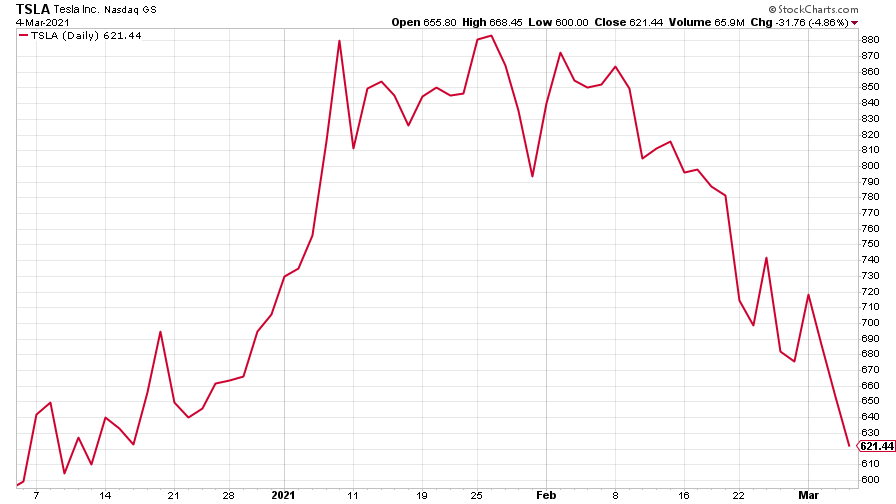
(Tesla: three months)
Have a great weekend.
Get the latest financial news, insights and expert analysis from our award-winning MoneyWeek team, to help you understand what really matters when it comes to your finances.

-
 RICS: UK housing market showing signs of 'tentative recovery'
RICS members are becoming less negative about property sales and house prices. What does the latest data mean for the property market?
-
 Last chance to invest in VCTs? Here's what you need to know
Investors have pumped millions more into Venture Capital Trusts (VCTS) so far this tax year, but time is running out to take advantage of tax perks from them.
-
 UK wages grow at a record pace
The latest UK wages data will add pressure on the BoE to push interest rates even higher.
-
 Trapped in a time of zombie government
It’s not just companies that are eking out an existence, says Max King. The state is in the twilight zone too.
-
 America is in deep denial over debt
The downgrade in America’s credit rating was much criticised by the US government, says Alex Rankine. But was it a long time coming?
-
 UK economy avoids stagnation with surprise growth
Gross domestic product increased by 0.2% in the second quarter and by 0.5% in June
-
 Bank of England raises interest rates to 5.25%
The Bank has hiked rates from 5% to 5.25%, marking the 14th increase in a row. We explain what it means for savers and homeowners - and whether more rate rises are on the horizon
-
 UK inflation remains at 8.7% ‒ what it means for your money
Inflation was unmoved at 8.7% in the 12 months to May. What does this ‘sticky’ rate of inflation mean for your money?
-
 Would a food price cap actually work?
Analysis The government is discussing plans to cap the prices of essentials. But could this intervention do more harm than good?
-
 Is my pay keeping up with inflation?
Analysis High inflation means take home pay is being eroded in real terms. An online calculator reveals the pay rise you need to match the rising cost of living - and how much worse off you are without it.
