The charts that matter: bubbling over?
As markets get decidedly bubbly, John Stepek looks at the action in the charts that matter most to the global economy.

Get the latest financial news, insights and expert analysis from our award-winning MoneyWeek team, to help you understand what really matters when it comes to your finances.
You are now subscribed
Your newsletter sign-up was successful
Want to add more newsletters?

Twice daily
MoneyWeek
Get the latest financial news, insights and expert analysis from our award-winning MoneyWeek team, to help you understand what really matters when it comes to your finances.

Four times a week
Look After My Bills
Sign up to our free money-saving newsletter, filled with the latest news and expert advice to help you find the best tips and deals for managing your bills. Start saving today!
Welcome back.
It’s getting bubbly out there. And the contents of this week’s podcast, magazine, “Too Embarrassed to Ask” video, and Money Morning emails, rather reflect that this week.
The podcast looks at all things bitcoin. Merryn Somerset Webb gets Dominic Frisby (who published a book on bitcoin back in 2014 – if you bought and held then, you’d be a very happy bunny today) and Charlie Morris (who specialises in valuing hard-to-value assets like gold and bitcoin) to talk about the cryptocurrency. Topics covered include: is this a bubble? How high can it go? How do you invest? And much more. You shouldn’t miss this one.
MoneyWeek
Subscribe to MoneyWeek today and get your first six magazine issues absolutely FREE

Sign up to Money Morning
Don't miss the latest investment and personal finances news, market analysis, plus money-saving tips with our free twice-daily newsletter
Don't miss the latest investment and personal finances news, market analysis, plus money-saving tips with our free twice-daily newsletter
As always, if you enjoy the podcast and you have the option to do so, please leave us a review.
In the magazine this week, we’ve put Elon Musk juggling bitcoins on the back of a unicorn on the front cover. That might be a surreal image but it’s not as surreal as some of the stuff going on in the US stock market. It’s pretty clearly in a bubble. But what can (or should) you do about it? Find out in this week’s issue. Get your first six mags free when you subscribe if you don’t already.
Meanwhile, our latest “Too Embarrassed To Ask” video looks at the background to one of today’s popular investment vehicles – the SPAC. These are really taking off in the US, but what are they, and why might investors want to be wary? Find out here.
Here are the links for this week’s editions of Money Morning and other web stories you may have missed.
- Monday: Yes US stocks are in a big bubble. But when will it burst?
- Tuesday: The price of this commodity has almost doubled since the start of the year
- Merryn’s blog: Should you buy into the bitcoin boom, or stick with gold?
- Wednesday: Of course bitcoin is a bubble – a bubble you can’t ignore
- Thursday: A simple way to profit from the next big trend change in the markets
- Friday: Forget austerity – governments and central banks have no intention of cutting back
Now for the charts of the week.
The charts that matter
Gold slipped again this week as the US dollar rallied. That’s driven partly by the rise in Treasury yields (which draws more money to the states) and partly because sentiment against the dollar has grown rather one-sided in recent months (so it doesn’t take a lot to send it higher).
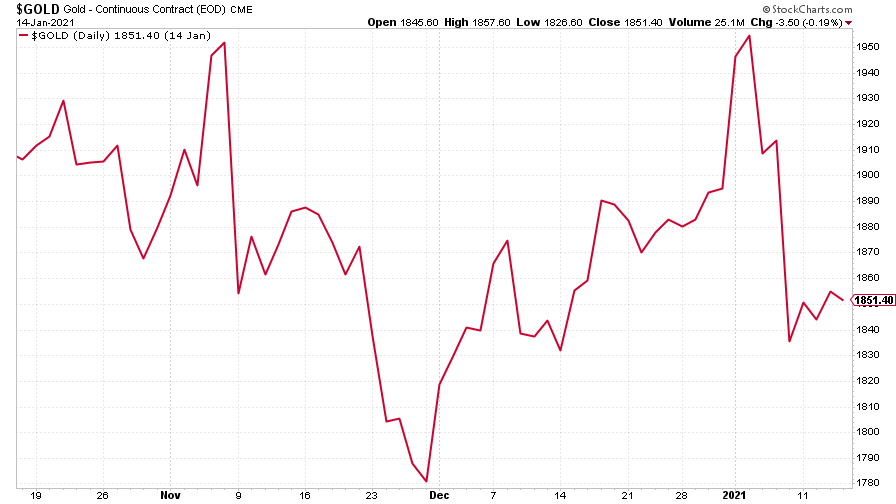
(Gold: three months)
The US dollar index (DXY – a measure of the strength of the dollar against a basket of the currencies of its major trading partners) has clawed its way back above the 90 mark.
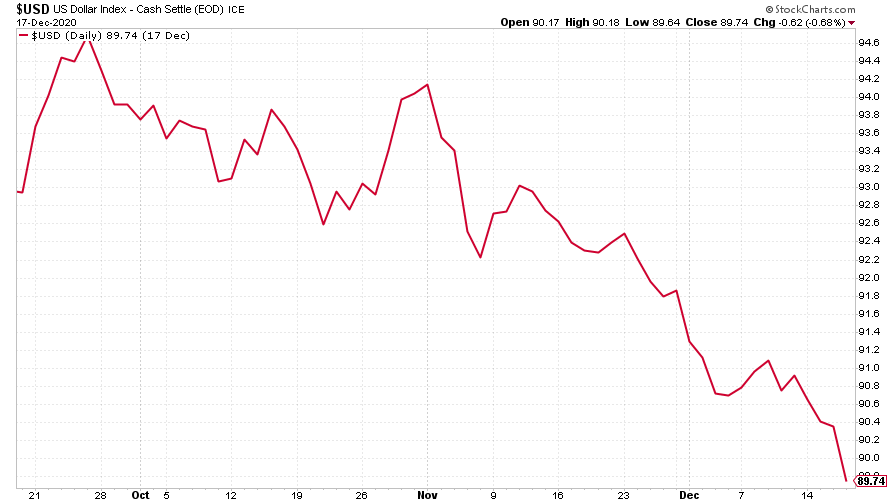
(DXY: three months)
The Chinese yuan (or renminbi) remains as strong against the US dollar as it has been for several years (when the black line is falling, the yuan is strengthening).
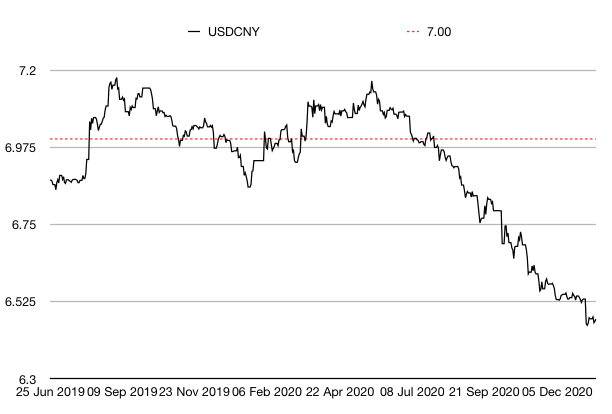
(Chinese yuan to the US dollar: since 25 Jun 2019)
The yield on the ten-year US government bond continued higher this week. It’s no surprise that the yield is rising (and thus bond prices are falling) given that the new US president, Joe Biden, wants to kick off his time in office by spending another $1.9 trillion on post-Covid recovery works.
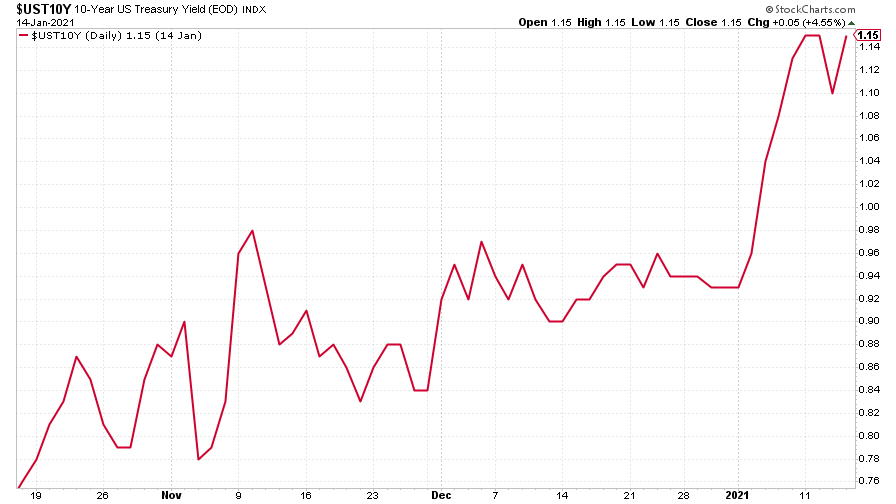
(Ten-year US Treasury yield: three months)
The yield on the Japanese ten-year moved in the opposite direction - it’s still on a tight leash.
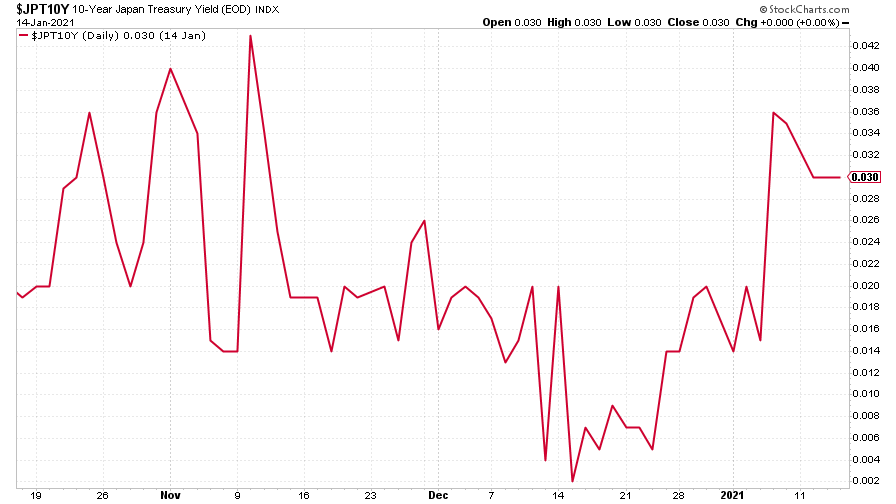
(Ten-year Japanese government bond yield: three months)
And the yield on the ten-year German Bund slipped back after pushing higher during the week.
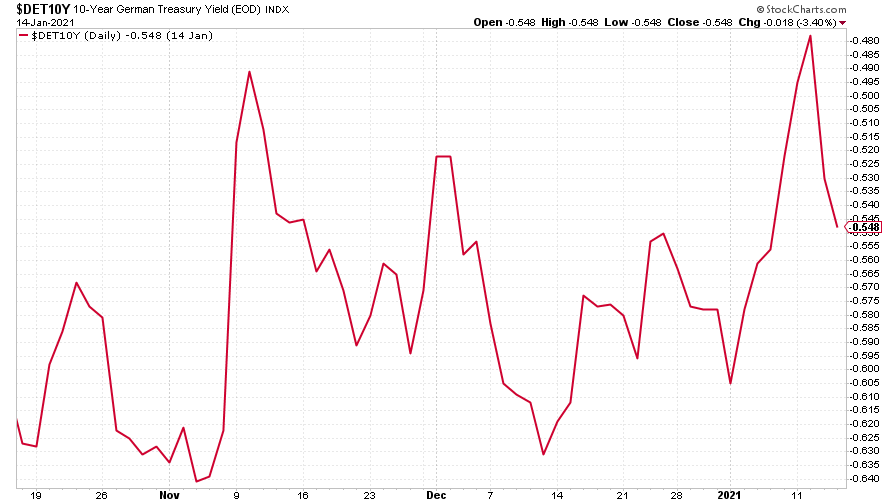
(Ten-year Bund yield: three months)
A little bit of the shine came off copper this week but it’s still performing strongly.
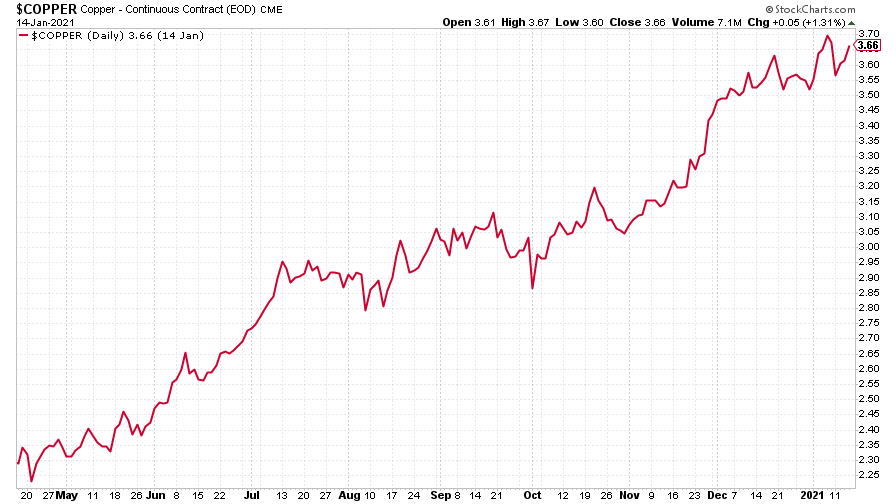
(Copper: nine months)
Similarly, the Aussie dollar was little changed on the week as the US dollar rallied.
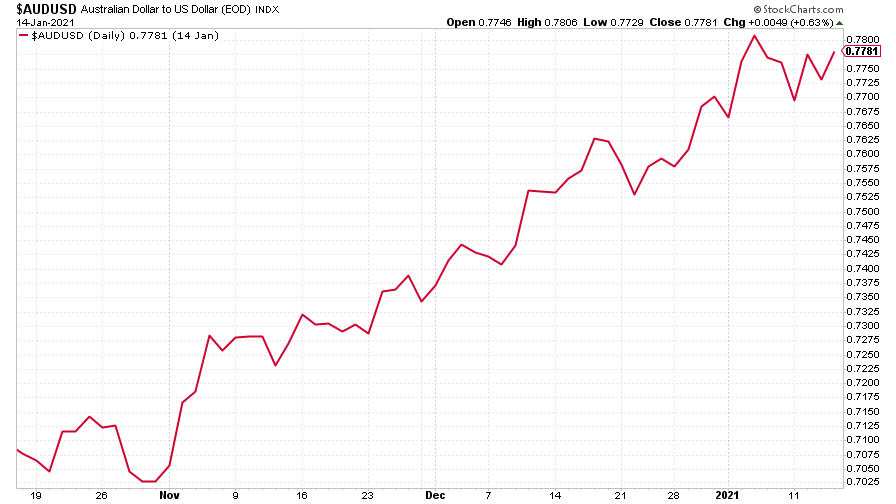
(Aussie dollar vs US dollar exchange rate: three months)
Cryptocurrency bitcoin is back into volatile mode, falling sharply then rebounding, then falling again. Don’t miss our podcast on the topic.
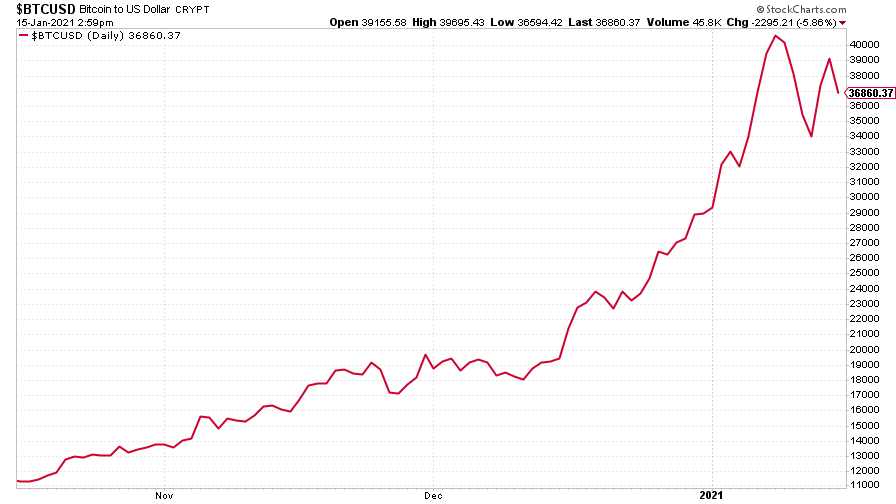
(Bitcoin: three months)
US weekly jobless claims came in at 965,000, which was much worse than expected, compared to 784,000 last week. The four-week moving average rose to 834,250 from 816,000 the week before.
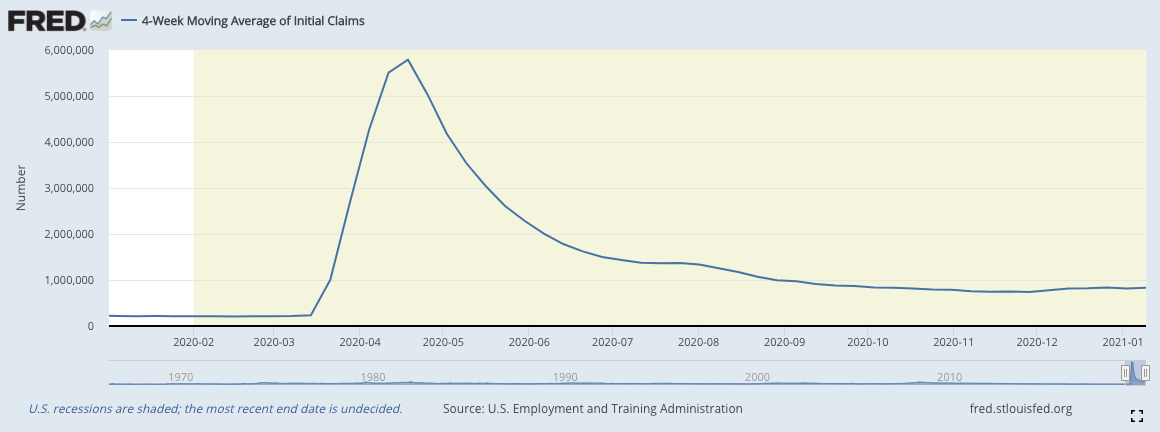
(US jobless claims, four-week moving average: since Jan 2020)
The oil price (as measured by Brent crude) continued to rise this week as the knock-on impact of the surprise Saudi Arabia production cut continued to reverberate around the market. A cold snap in Asia also boosted demand.
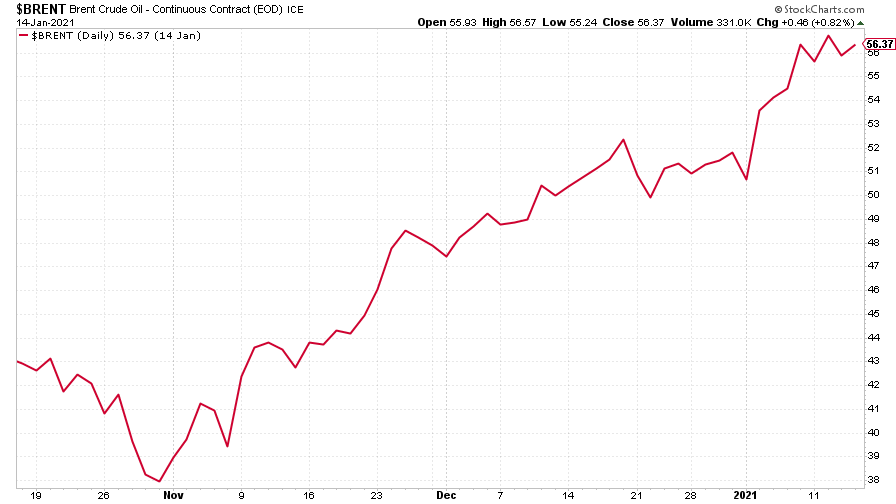
(Brent crude oil: three months)
Amazon drifted lower again this week.
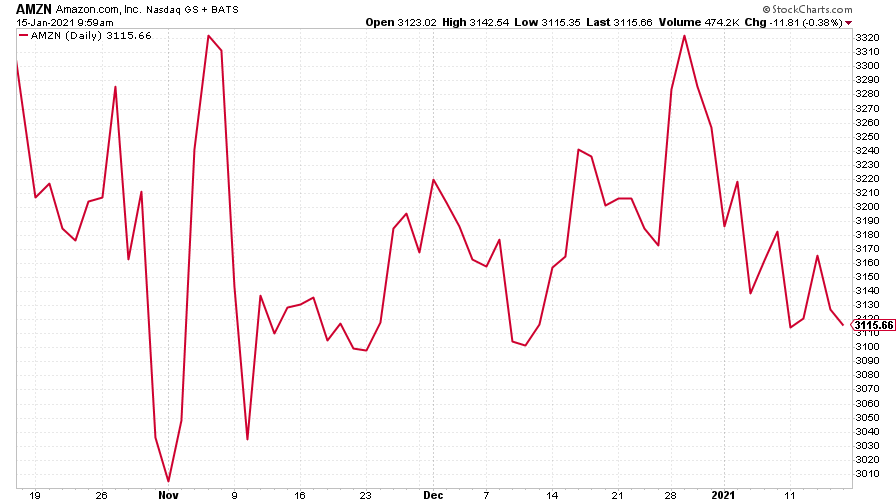
(Amazon: three months)
Meanwhile Tesla came off its recent highs.
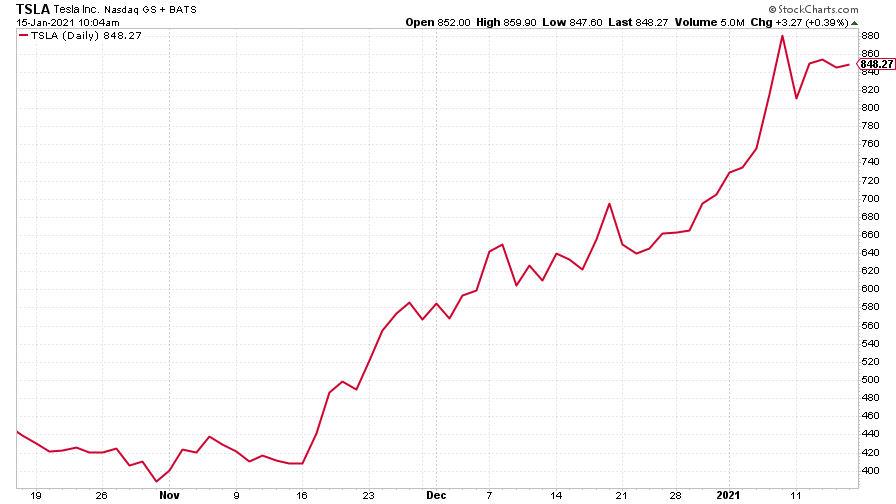
(Tesla: three months)
Have a great weekend.
Get the latest financial news, insights and expert analysis from our award-winning MoneyWeek team, to help you understand what really matters when it comes to your finances.

-
 Should you buy an active ETF?
ETFs are often mischaracterised as passive products, but they can be a convenient way to add active management to your portfolio
-
 Power up your pension before 5 April – easy ways to save before the tax year end
With the end of the tax year looming, pension savers currently have a window to review and maximise what’s going into their retirement funds – we look at how
-
 UK wages grow at a record pace
The latest UK wages data will add pressure on the BoE to push interest rates even higher.
-
 Trapped in a time of zombie government
It’s not just companies that are eking out an existence, says Max King. The state is in the twilight zone too.
-
 America is in deep denial over debt
The downgrade in America’s credit rating was much criticised by the US government, says Alex Rankine. But was it a long time coming?
-
 UK economy avoids stagnation with surprise growth
Gross domestic product increased by 0.2% in the second quarter and by 0.5% in June
-
 Bank of England raises interest rates to 5.25%
The Bank has hiked rates from 5% to 5.25%, marking the 14th increase in a row. We explain what it means for savers and homeowners - and whether more rate rises are on the horizon
-
 UK inflation remains at 8.7% ‒ what it means for your money
Inflation was unmoved at 8.7% in the 12 months to May. What does this ‘sticky’ rate of inflation mean for your money?
-
 Would a food price cap actually work?
Analysis The government is discussing plans to cap the prices of essentials. But could this intervention do more harm than good?
-
 Is my pay keeping up with inflation?
Analysis High inflation means take home pay is being eroded in real terms. An online calculator reveals the pay rise you need to match the rising cost of living - and how much worse off you are without it.