The charts that matter: are we there yet?
Markets rallied in a week when the world's central banks unleashed a torrent of newly-printed money. John Stepek looks at what's happened to the charts that matter most to the global economy.

Get the latest financial news, insights and expert analysis from our award-winning MoneyWeek team, to help you understand what really matters when it comes to your finances.
You are now subscribed
Your newsletter sign-up was successful
Want to add more newsletters?

Twice daily
MoneyWeek
Get the latest financial news, insights and expert analysis from our award-winning MoneyWeek team, to help you understand what really matters when it comes to your finances.

Four times a week
Look After My Bills
Sign up to our free money-saving newsletter, filled with the latest news and expert advice to help you find the best tips and deals for managing your bills. Start saving today!
Welcome back.
It’s been another historic week (just for a change). The Federal Reserve – America’s central bank – started the week by promising that it would buy just about anything from anyone, then on Thursday, the European Central Bank said it would also buy anything, up to and including Italian government debt, in order to prop up the eurozone.
The US government also passed a $2trn stimulus that involves, among other things, sending money direct to households; while in the UK, chancellor Rishi Sunak extended protection for employees to the self employed.
MoneyWeek
Subscribe to MoneyWeek today and get your first six magazine issues absolutely FREE

Sign up to Money Morning
Don't miss the latest investment and personal finances news, market analysis, plus money-saving tips with our free twice-daily newsletter
Don't miss the latest investment and personal finances news, market analysis, plus money-saving tips with our free twice-daily newsletter
It’s probably a good thing they’re pulling out the stops because, more grimly, US weekly jobless claims saw a shocking rise to more than three million – compared to less than 300,000 the week before. That’s never been seen before. And unemployment figures across the globe will only get worse in the weeks ahead.
Nevertheless, markets have rallied strongly this week. Have we seen the bottom? Your guess is as good as mine (because that’s all anyone is doing when they try to time the market). But I’ll share it with you anyway.
I suspect we haven’t. I suspect that another reality check lies ahead for markets and that they’ve now grown too confident in the “V-shaped” recovery scenario. I suspect that we will retest the most recent lows at some point in the next few months, and at that point, we might even go lower.
Obviously a lot of that depends on how government and central bank assistance flows through the market but as things stand, I feel it’s more likely than not that there’s another panic to come. I might be wrong but that’s my gut feeling for now.
At the same time, investing isn’t about picking the bottom of the market – it’s about finding value. So I also suspect that anyone who bought decent quality stocks at panic prices last week won’t regret it in the long run, even if prices do get back down there in the near term. You can learn more about our view in MoneyWeek magazine – subscribe now and get your first six issues free if you haven’t already.
Anyway, so packed has been the news cycle that Merryn and I recorded a podcast for the third week running – this is also unprecedented, I believe. We weren’t as cheerful as usual (!) but we did talk a lot about box schemes and turnips. Not only that, but Merryn then went and recorded an extra podcast with Charles Heenan of Kennox. If you like gold, you’ll like this podcast.
And here are the links for this week’s editions of Money Morning plus other stories you might have missed on the website this week.
- Monday: Markets are starting to realise just how bad the coronavirus crisis will be
- Merryn’s blog: Coronavirus and tax: now isn’t a time to have to worry about money
- Tuesday:The Federal Reserve goes all-out in the battle against coronavirus
- Wednesday: Gold is hard to find right now – so should you be buying?
- Merryn’s Blog: How to protect the earnings of the self-employed as well as employees
- Thursday: The European Central Bank throws away the rulebook to bail out Italy
- Friday: What does the coronavirus crisis mean for UK house prices?
- Subscribe to MoneyWeek now and get your first six issues free!
- Buy The Sceptical Investor – your guide to contrarian investing
The charts that matter
Gold (measured in dollar terms) rocketed this week. How could it not, you might think, with all these central banks declaring their intentions to print as much money as they need to in order to save the world, and governments doing the same? That’s a fair point and it’s also one reason we hold gold.
Equally, the US dollar weakened this week (which often, though not always, helps gold), while the immediate dash for liquidity – which saw gold sell off during the most panicky days – has passed for the time being. Be prepared to see more of that though as the knock-on effects of the shutdown start to pass through the economic figures. There will inevitably be some bankruptcies and an awful lot of delayed payments and that could cause a lot of messiness despite the Fed’s best efforts.
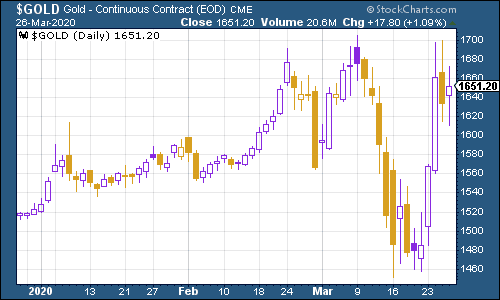
(Gold: three months)
The US dollar index – a measure of the strength of the dollar against a basket of the currencies of its major trading partners – finally hit a ceiling (for now). The Fed’s efforts to convince markets that it is both willing and able to do “whatever it takes” helped to stop the desperate rush to safety. Indeed, if the Fed feels pleased about anything this week, it’ll be the sudden end to the US dollar’s surge.
Keep a close eye on this. A strong dollar is a real problem for the global economy at this point, as it represents a “risk-off”, tighter money environment that the world’s markets and economies can’t currently cope with.
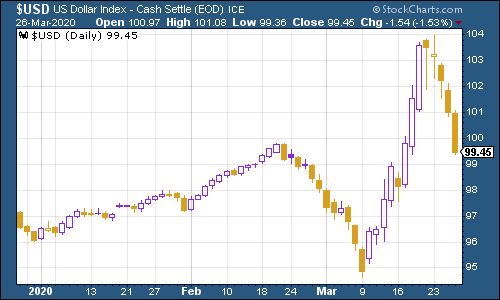
(DXY: three months)
The Chinese yuan (or renminbi) is still above the $1/¥7 mark that gets markets nervous, but the line was moving in the right direction (ie, lower) as the week began to draw to a close.
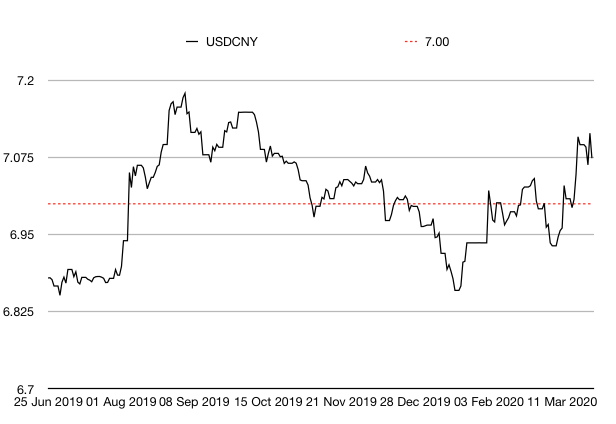
(Chinese yuan to the US dollar: since 25 Jun 2019)
The yield on the ten-year US government bond fell again. This is despite the Fed’s money-printing intentions. It’s all a little complicated but the big sell-off of the previous week was driven by a rush for liquidity (people needing money fast to offset losses elsewhere).
For now, investors still want to own Treasuries and are, of course, worried by how much damage might be done to the economy in the near-term. The crash is deflationary, no doubt about it (which makes Treasury bonds with their fixed income payment appealing).
It’s the longer-term measures taken to hasten the recovery that might make Treasuries (and other government bonds) a lot less appealing at some point down the line.
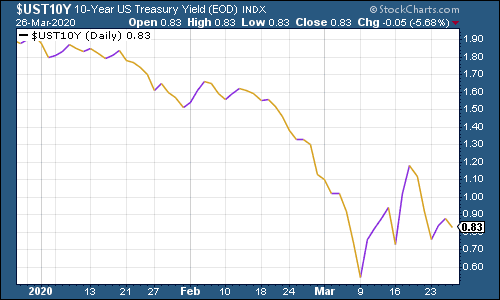
(Ten-year US Treasury yield: three months)
The yield on the Japanese ten-year also slipped back, although they remained in slightly positive territory.
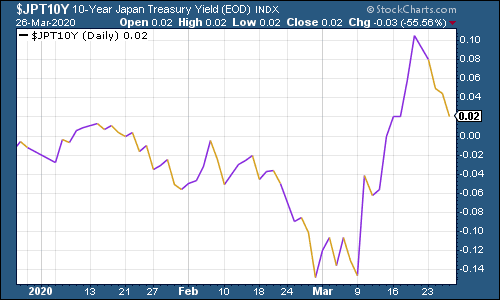
(Ten-year Japanese government bond yield: three months)
And the yield on the ten-year German bund slipped further back into negative territory although it remained well above the panic lows.
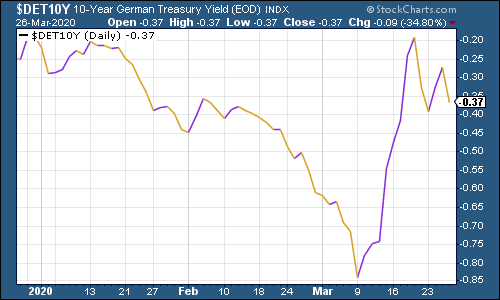
(Ten-year Bund yield: three months)
Copper is worth watching. It is hardly rocketing higher but it isn’t falling further. From a technical point of view (ie, from looking purely at the chart) this is quite an important level. Below you can see why.
I’ve extended the chart out to 2015 for a better view. You can see that by the start of 2016, copper (and most other commodities) had hit rock bottom, partly because of fears over the Chinese economy. It came back from there to peak in mid-2018.
Now it has fallen back down to the 2016 lows and bounced off them. Chartists would argue that as long as it holds above the 2016 low, there’s hope that we’re near the bottom for markets. If it breaks down through that level – well, look out below.
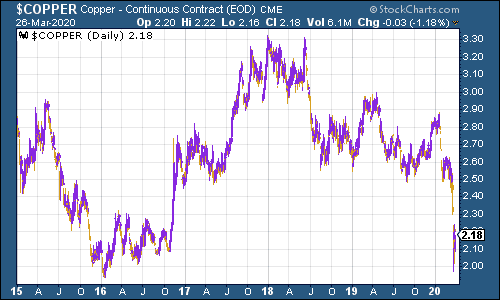
(Copper: five years and three months)
The Aussie dollar bounced a bit this week as the pressure from the US dollar eased.
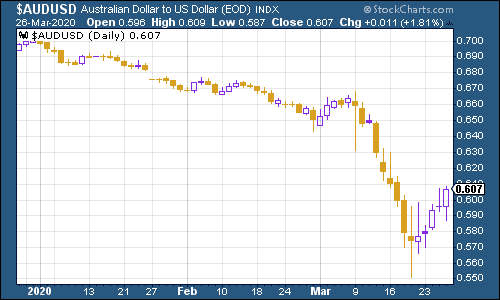
(Aussie dollar vs US dollar exchange rate: three months)
Cryptocurrency bitcoin didn’t do anything out of the ordinary – a gain of about 40% in ten days is pretty much standard practice for the digital currency.
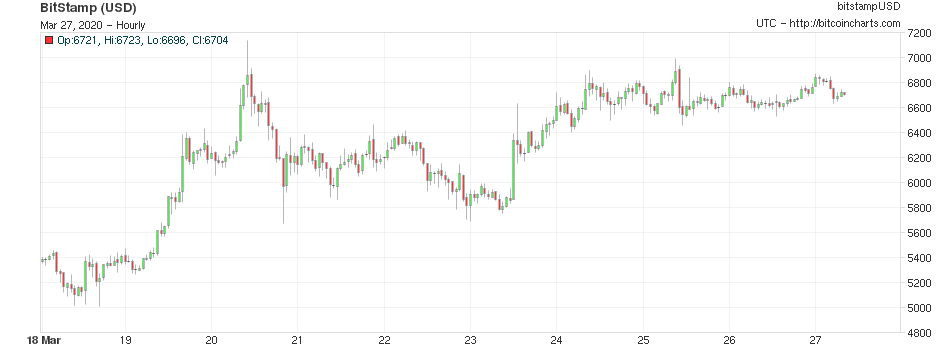
(Bitcoin: ten days)
This is clearly the most terrifying chart of the week, no question about it. US weekly jobless claims rocketed higher to 3.3 million from just 281,000 last week. That was a record, and much worse than expected – Goldman Sachs thought it would be just above two million. The four-week moving average now sits at an extraordinary 998,250 – that’s the vertical line at the end of the chart below.
If there was any doubt that we’re facing a recession, well – I mean, forget it. The hope now is that efforts by the government can make this line fall fast. But it’s going to be up there for a few weeks to come at the very least.
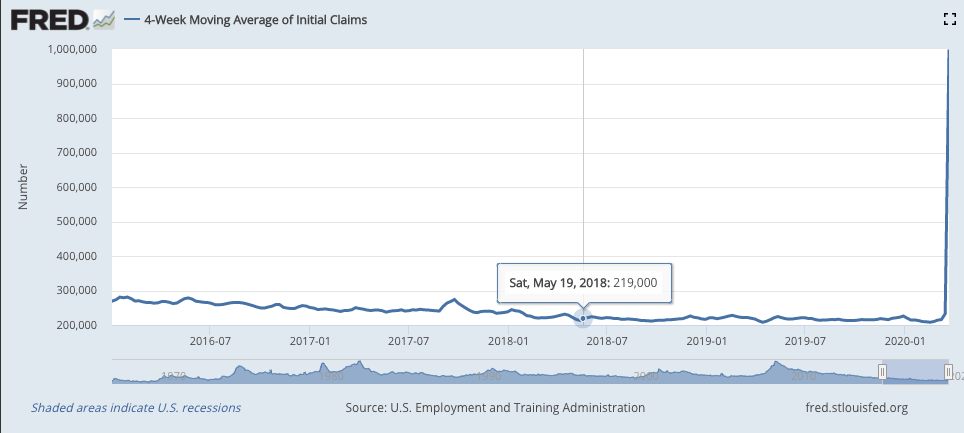
(US jobless claims, four-week moving average: since January 2016)
The oil price (as measured by Brent crude, the international/European benchmark) is another worrying chart. Low oil prices are good for consumers but they don’t help in and of themselves when the reason prices are low is because people can’t drive (you’re saving the money anyway!). So the reason low prices aren’t good from a financial outlook point of view is that a) they show that the economy has taken a hard knock and that there’s a long way to go; and b) there’s the risk that at this price, lots of US shale producers must go bust, and a lot of their debt therefore becomes worthless, which may have a knock-on effect in corporate bond markets.
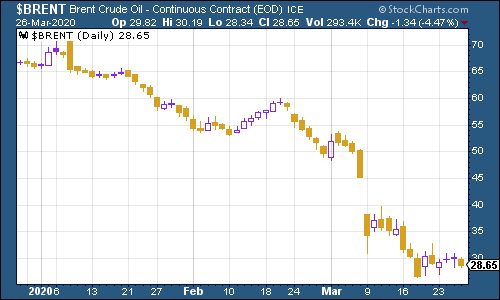
(Brent crude oil: three months)
Amazon rallied – it’s the stock where buying on the dips won’t get you fired. And it’s also one that should logically benefit from today’s lockdowns. If online retail gets a whole load of new, forced converts to internet shopping then Amazon is going to become even more dominant in the market.
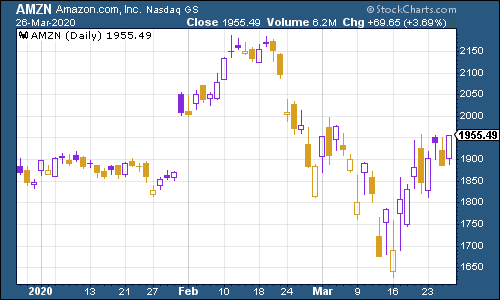
(Amazon: three months)
Electric car group Tesla remains resilient. Somehow.
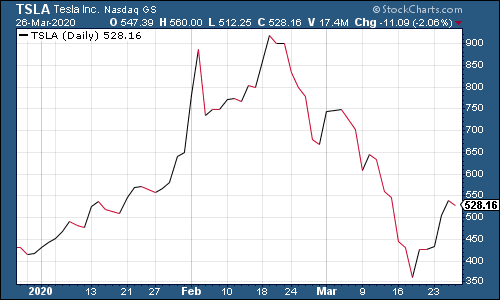
(Tesla: three months)
Have a good weekend.
John
Get the latest financial news, insights and expert analysis from our award-winning MoneyWeek team, to help you understand what really matters when it comes to your finances.

-
 Average UK house price reaches £300,000 for first time, Halifax says
While the average house price has topped £300k, regional disparities still remain, Halifax finds.
-
 Barings Emerging Europe trust bounces back from Russia woes
Barings Emerging Europe trust has added the Middle East and Africa to its mandate, delivering a strong recovery, says Max King
-
 UK wages grow at a record pace
The latest UK wages data will add pressure on the BoE to push interest rates even higher.
-
 Trapped in a time of zombie government
It’s not just companies that are eking out an existence, says Max King. The state is in the twilight zone too.
-
 America is in deep denial over debt
The downgrade in America’s credit rating was much criticised by the US government, says Alex Rankine. But was it a long time coming?
-
 UK economy avoids stagnation with surprise growth
Gross domestic product increased by 0.2% in the second quarter and by 0.5% in June
-
 Bank of England raises interest rates to 5.25%
The Bank has hiked rates from 5% to 5.25%, marking the 14th increase in a row. We explain what it means for savers and homeowners - and whether more rate rises are on the horizon
-
 UK inflation remains at 8.7% ‒ what it means for your money
Inflation was unmoved at 8.7% in the 12 months to May. What does this ‘sticky’ rate of inflation mean for your money?
-
 Would a food price cap actually work?
Analysis The government is discussing plans to cap the prices of essentials. But could this intervention do more harm than good?
-
 Is my pay keeping up with inflation?
Analysis High inflation means take home pay is being eroded in real terms. An online calculator reveals the pay rise you need to match the rising cost of living - and how much worse off you are without it.