The charts that matter: the helicopters are unleashed
In a week when all sense of what's normal went out the window, John Stepek looks at what's happened to the charts that matter most to the global economy.

Get the latest financial news, insights and expert analysis from our award-winning MoneyWeek team, to help you understand what really matters when it comes to your finances.
You are now subscribed
Your newsletter sign-up was successful
Want to add more newsletters?

Twice daily
MoneyWeek
Get the latest financial news, insights and expert analysis from our award-winning MoneyWeek team, to help you understand what really matters when it comes to your finances.

Four times a week
Look After My Bills
Sign up to our free money-saving newsletter, filled with the latest news and expert advice to help you find the best tips and deals for managing your bills. Start saving today!
Good lord.
As I’m writing this, the chancellor Rishi Sunak (future PM? Maybe, as long as he doesn’t peak too soon or steal too much thunder) has just told us all that any business in the UK can ask the government to pay 80% of the wages of employees who would otherwise be laid off.
That’s incredible. The amount covered (£2,500 a month) is more than the average wage too, so this doesn’t come with a massive catch attached.
MoneyWeek
Subscribe to MoneyWeek today and get your first six magazine issues absolutely FREE

Sign up to Money Morning
Don't miss the latest investment and personal finances news, market analysis, plus money-saving tips with our free twice-daily newsletter
Don't miss the latest investment and personal finances news, market analysis, plus money-saving tips with our free twice-daily newsletter
Of course, the government really had to do this because it’s shutting down all the pubs and clubs and everywhere that we go to socialise, because we can’t be trusted to stay inside ourselves (understandable if not commendable).
In our podcast earlier in the week, Merryn and I were musing on the end of capitalism and what happens now that the government is so heavily involved in the economy. Don’t get me wrong – the current crisis justifies this. This is not like 2008 (I still feel that the bank bailouts were probably necessary but definitely handled wrongly). This is needed. It genuinely is more sensible to think of this as a wartime footing, with the sorts of rampant rises in government debt that go with that.
But what happens when the crisis passes? That’ll be the start of a new era altogether.
Anyway, have a listen to that here. (You’ll also hear me play the drums very briefly).
And here are the links for this week’s editions of Money Morning plus other stories you might have missed on the website this week.
- Monday: Helicopter money is coming very soon – but what form will it take?
- Merryn’s blog: Sunak’s Budget: good, but short-term measures must be temporary
- Tuesday:The helicopters are being warmed up – we might be closer to a bottom than you think
- Wednesday: Extraordinary times create extraordinary opportunities – these assets look cheap
- Thursday: How the US dollar standard is now suffocating the global economy
- Another emergency rate cut: The Bank of England chucks the kitchen sink at coronavirus
- Friday: The corona crisis will mark the end of the longest-running trend in markets
- Subscribe to MoneyWeek now
- Buy The Sceptical Investor – your guide to contrarian investing
The charts that matter
Gold (measured in dollar terms) had another rough week. That’s because everyone needs dollars and because the most liquid stuff has been sold off. Again, I’d emphasise – holding some gold when governments around the world are printing money like mad is not a bad idea because of the potential long-term consequences.
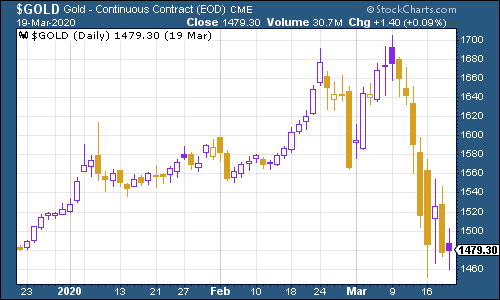
(Gold: three months)
The US dollar index – a measure of the strength of the dollar against a basket of the currencies of its major trading partners – continued to surge. I explained some of the reasons behind this in Money Morning this week and the Federal Reserve has been trying to address it, so we’ll see if any of the pressure is alleviated next week.
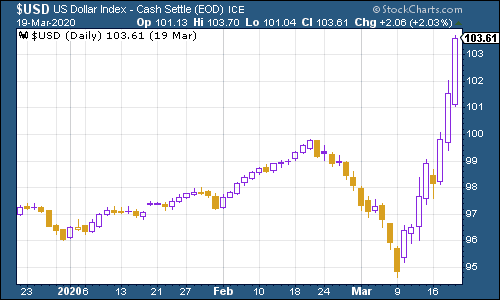
(DXY: three months)
The Chinese yuan (or renminbi) weakened further beyond the $1/¥7 mark that gets markets nervous, but again this is a pretty minor point in a week like this.
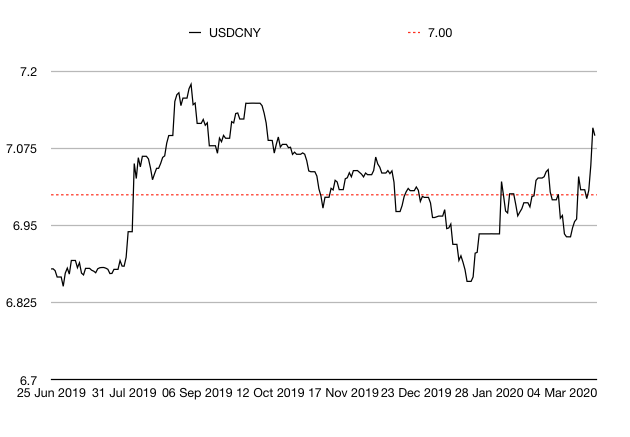
(Chinese yuan to the US dollar: since 25 Jun 2019)
The yield on the ten-year US government bond continued to rise. This is partly the rush for liquidity and partly because investors realise governments will print “whatever it takes”.
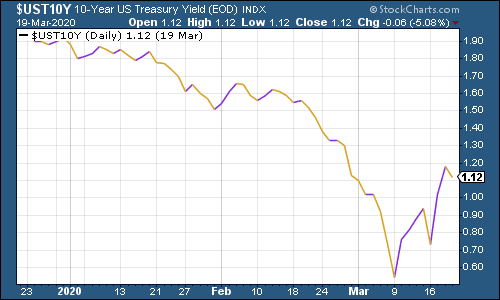
(Ten-year US Treasury yield: three months)
The yield on the Japanese ten-year also rose higher, all the way into slightly positive territory.
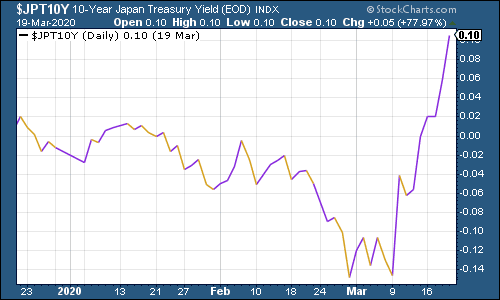
(Ten-year Japanese government bond yield: three months)
And the yield on the ten-year German Bund ticked higher too although it remained in negative territory.
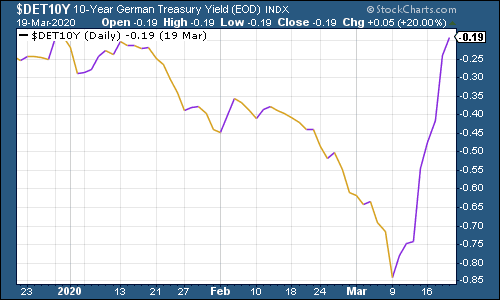
(Ten-year Bund yield: three months)
Copper finally gave up the ghost and collapsed lower.
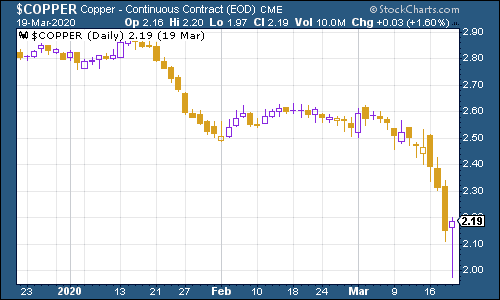
(Copper: six months)
The Aussie dollar collapsed lower too.
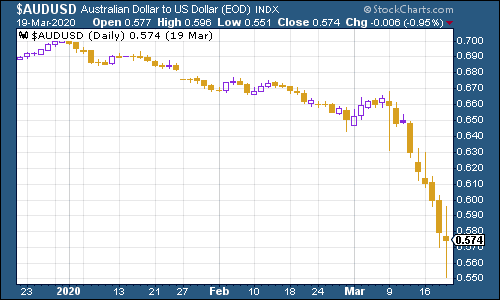
(Aussie dollar vs US dollar exchange rate: three months)
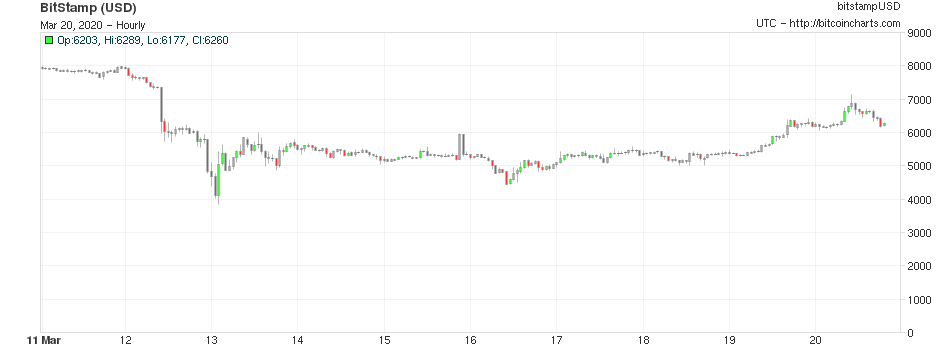
Cryptocurrency bitcoin had a surprisingly calm week relative to everything else.
(Bitcoin: ten days)
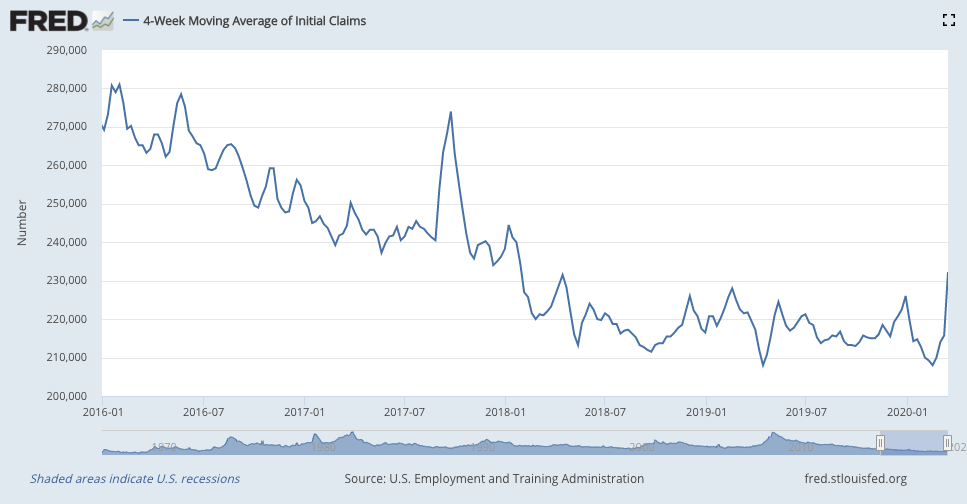
US weekly jobless claims rocketed higher to 281,000. The four-week moving average now sits at 232,250. Clearly, we’ve seen the trough for this cycle. And it’s going to get a lot worse – Goldman Sachs estimated a surge to over two million next week (that’s not a typo).
(US jobless claims, four-week moving average: since January 2016)
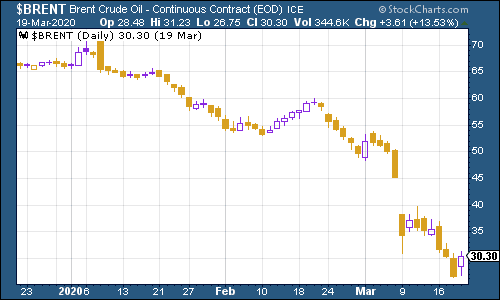
The oil price (as measured by Brent crude, the international/European benchmark) continued to fall although it rallied a little towards the end of the week as American hinted that it might intervene to buy more oil to prop up US shale producers.
(Brent crude oil: three months)
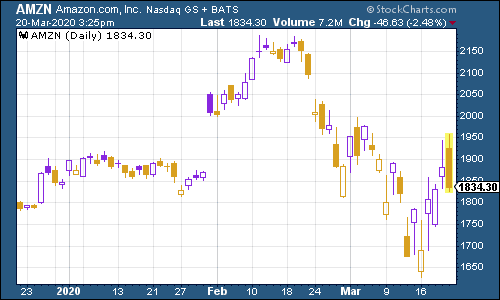
Amazon rallied – if any company might do well out of everyone being stuck at home for a prolonged period, you’d think it would be Amazon.
(Amazon: three months)
Electric car group Tesla continued to fall back, although it’s still well ahead of where it was a year ago.
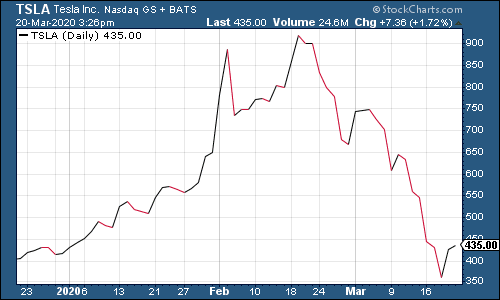
(Tesla: three months)
Have a good weekend.
Get the latest financial news, insights and expert analysis from our award-winning MoneyWeek team, to help you understand what really matters when it comes to your finances.

-
 Average UK house price reaches £300,000 for first time, Halifax says
While the average house price has topped £300k, regional disparities still remain, Halifax finds.
-
 Barings Emerging Europe trust bounces back from Russia woes
Barings Emerging Europe trust has added the Middle East and Africa to its mandate, delivering a strong recovery, says Max King
-
 UK wages grow at a record pace
The latest UK wages data will add pressure on the BoE to push interest rates even higher.
-
 Trapped in a time of zombie government
It’s not just companies that are eking out an existence, says Max King. The state is in the twilight zone too.
-
 America is in deep denial over debt
The downgrade in America’s credit rating was much criticised by the US government, says Alex Rankine. But was it a long time coming?
-
 UK economy avoids stagnation with surprise growth
Gross domestic product increased by 0.2% in the second quarter and by 0.5% in June
-
 Bank of England raises interest rates to 5.25%
The Bank has hiked rates from 5% to 5.25%, marking the 14th increase in a row. We explain what it means for savers and homeowners - and whether more rate rises are on the horizon
-
 UK inflation remains at 8.7% ‒ what it means for your money
Inflation was unmoved at 8.7% in the 12 months to May. What does this ‘sticky’ rate of inflation mean for your money?
-
 Would a food price cap actually work?
Analysis The government is discussing plans to cap the prices of essentials. But could this intervention do more harm than good?
-
 Is my pay keeping up with inflation?
Analysis High inflation means take home pay is being eroded in real terms. An online calculator reveals the pay rise you need to match the rising cost of living - and how much worse off you are without it.