
-

New Federal Reserve chair Kevin Warsh has his work cut out
Opinion Kevin Warsh must make it clear that he, not Trump, is in charge at the Fed. If he doesn't, the US dollar and Treasury bills sell-off will start all over again
Opinion -
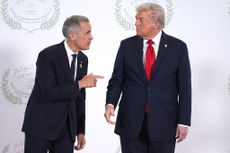
How Canada's Mark Carney is taking on Donald Trump
Canada has been in Donald Trump’s crosshairs ever since he took power and, under PM Mark Carney, is seeking strategies to cope and thrive. How’s he doing?
-

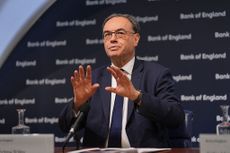
UK interest rates live: rates held at 3.75%
The Bank of England’s Monetary Policy Committee (MPC) met today to decide UK interest rates, and voted to hold rates at their current level
-
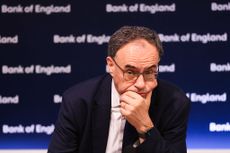
Will UK interest rates fall in 2026? Latest Bank of England predictions
The Bank of England will decide interest rates this week. Will we see another cut on Thursday?
-
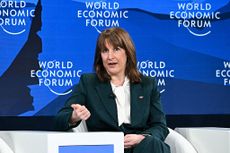
Rachel Reeves is rediscovering the Laffer curve
Opinion If you keep raising taxes, at some point, you start to bring in less revenue. Rachel Reeves has shown the way, says Matthew Lynn
Opinion -

The enshittification of the internet – what it means for us
Why do transformative digital technologies start out as useful tools but then gradually get worse and worse? There is a reason for it – but is there a way out?
-

Should you sell your US stocks?
The turbulent events of 2025 and early 2026 have dealt a blow to the concept of US exceptionalism, but the US stock market is still going strong
-
When is the next Bank of England base rate meeting?
The Bank of England cut interest rates to 3.75% in December 2025. When is the next Monetary Policy Committee meeting and will interest rates fall further in 2026?
-

What is your personal inflation rate and how do you calculate it?
Inflation in the UK has been consistently above the 2% target since late 2024, but the high price growth will affect people to differing degrees.


