Get the latest financial news, insights and expert analysis from our award-winning MoneyWeek team, to help you understand what really matters when it comes to your finances.
You are now subscribed
Your newsletter sign-up was successful
Want to add more newsletters?

Twice daily
MoneyWeek
Get the latest financial news, insights and expert analysis from our award-winning MoneyWeek team, to help you understand what really matters when it comes to your finances.

Four times a week
Look After My Bills
Sign up to our free money-saving newsletter, filled with the latest news and expert advice to help you find the best tips and deals for managing your bills. Start saving today!
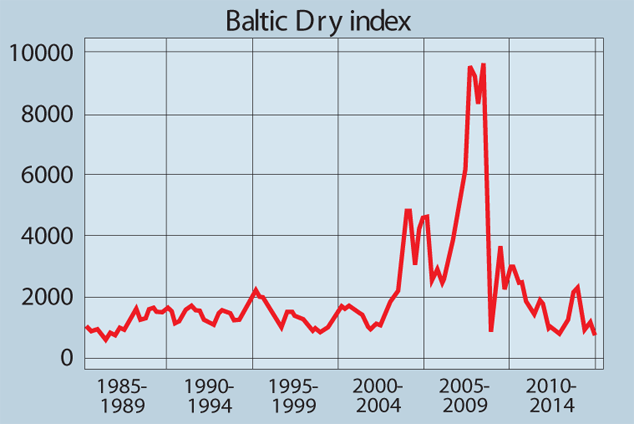
A widely watched leading indicator of global growth has slid by 60% to a 29-year low over the past three months. The Baltic Dry index tracks shipping rates for dry-bulk commodities, such as coal and iron. The slump seems to imply a sharp drop in demand for commodities.
But this indicator has "lost predictive power" since 2008, says Robert Milburn on Barron's.com. Just before the crisis, a glut of ships emerged, created by the scramble to feed China's hunger for raw materials. Since 2009 the global economy has gradually recovered, but it still hasn't soaked up the oversupply of ships, which still exceed demand by around 20%.
The surplus explains why the index has borne little relation to the ups and down of the global economy since the crisis. A lower oil price has reduced fuel costs for ships of late, while there is often a sharp drop before China takes a week off for its New Year.
MoneyWeek
Subscribe to MoneyWeek today and get your first six magazine issues absolutely FREE

Sign up to Money Morning
Don't miss the latest investment and personal finances news, market analysis, plus money-saving tips with our free twice-daily newsletter
Don't miss the latest investment and personal finances news, market analysis, plus money-saving tips with our free twice-daily newsletter
Get the latest financial news, insights and expert analysis from our award-winning MoneyWeek team, to help you understand what really matters when it comes to your finances.
MoneyWeek is written by a team of experienced and award-winning journalists, plus expert columnists. As well as daily digital news and features, MoneyWeek also publishes a weekly magazine, covering investing and personal finance. From share tips, pensions, gold to practical investment tips - we provide a round-up to help you make money and keep it.
-
 Average UK house price reaches £300,000 for first time, Halifax says
While the average house price has topped £300k, regional disparities still remain, Halifax finds.
-
 Barings Emerging Europe trust bounces back from Russia woes
Barings Emerging Europe trust has added the Middle East and Africa to its mandate, delivering a strong recovery, says Max King
-
 The charts that matter: bond yields and US dollar continue to climb
Charts The US dollar and government bond yields around the world continued to climb. Here’s what happened to the charts that matter most to the global economy.
-
 The charts that matter: markets start the year with a crash
Charts As markets start 2022 with a big selloff, here’s what happened to the charts that matter most to the global economy.
-
 The charts that matter: Fed becomes more hawkish
Charts Gold rose meanwhile the US dollar fell after a key Fed meeting. Here’s what else happened to the charts that matter most to the global economy.
-
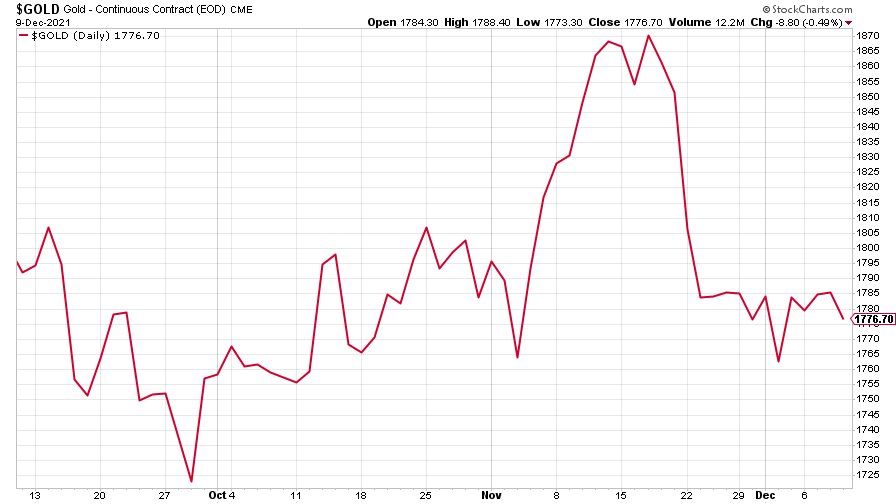 The charts that matter: a tough week for bitcoin
Charts Cryptocurrency bitcoin slid by some 20% this week. Here’s what else happened to the charts that matter most to the global economy.
-
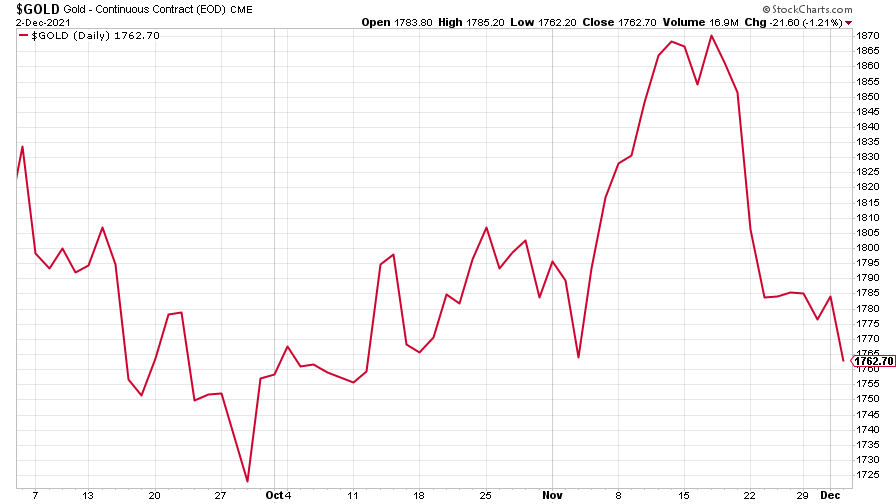 The charts that matter: omicron rattles markets
Charts Markets were rattled by the emergence of a new strain of Covid-19. Here’s how it has affected the charts that matter most to the global economy.
-
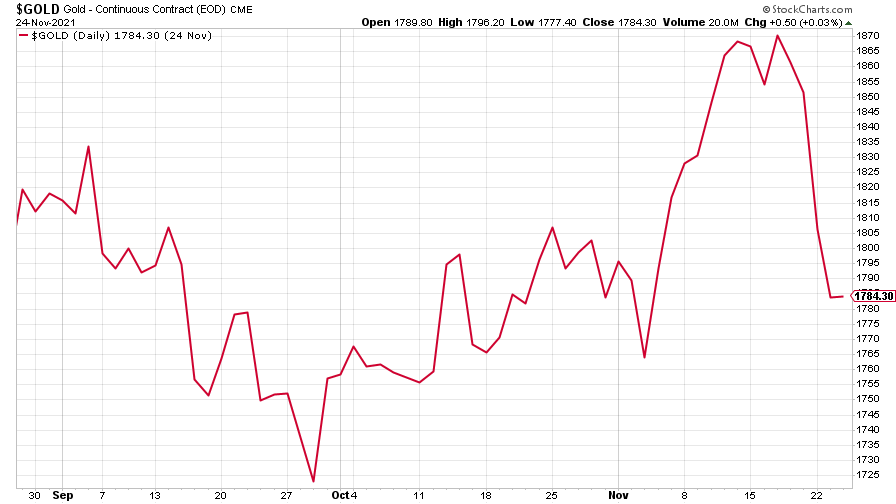 The charts that matter: the US dollar keeps on strengthening
Charts The US dollar saw further rises this week as gold and cryptocurrencies sold off. Here’s how that has affected the charts that matter most to the global economy.
-
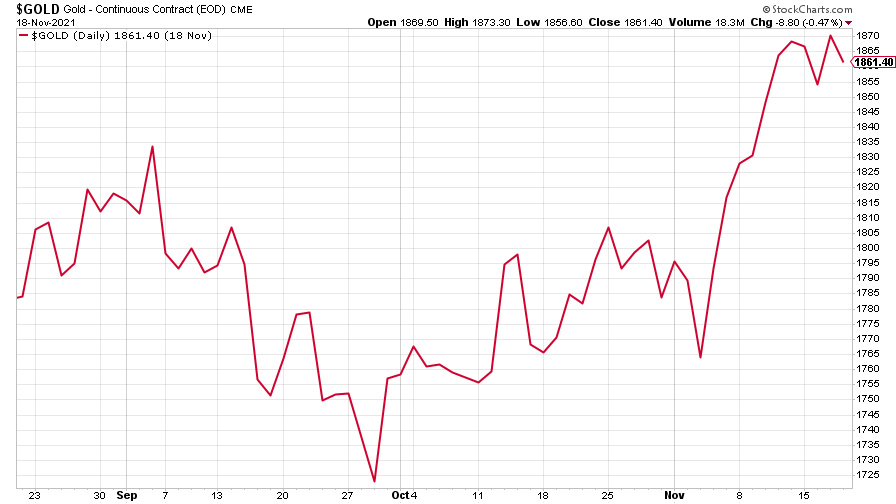 The charts that matter: gold hangs on to gains while the dollar continues higher
Charts The gold price continued to hang on to last week’s gains, even as the US dollar powered higher this week. Here’s how that has affected the charts that matter most to the global economy.
-
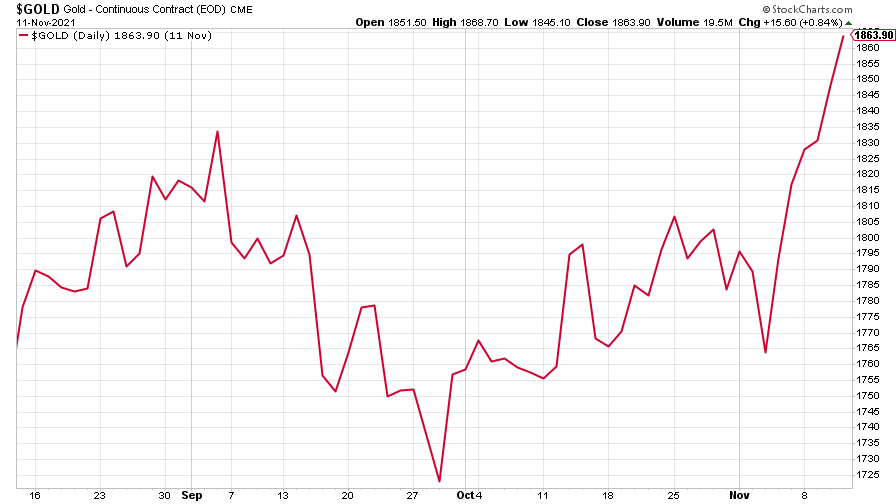 The charts that matter: inflation fears give gold a much needed boost
Charts US inflation hit its highest in 30 years this week, driving gold and bitcoin to new highs. Here’s how that has affected the charts that matter most to the global economy.

