Are we in a stockmarket bubble? I wouldn't be so sure
Markets are less expensive than they look given all the money sloshing around, argues Michael Howell of CrossBorder Capital.

Get the latest financial news, insights and expert analysis from our award-winning MoneyWeek team, to help you understand what really matters when it comes to your finances.
You are now subscribed
Your newsletter sign-up was successful
Want to add more newsletters?

Twice daily
MoneyWeek
Get the latest financial news, insights and expert analysis from our award-winning MoneyWeek team, to help you understand what really matters when it comes to your finances.

Four times a week
Look After My Bills
Sign up to our free money-saving newsletter, filled with the latest news and expert advice to help you find the best tips and deals for managing your bills. Start saving today!
All money that is anywhere must, of course, be somewhere. This simple truth explains why the $50-odd trillion (roughly £36trn) of extra liquidity, injected following the Covid-19 lockdowns, has inflated global asset markets, sending share prices to new highs, causing house prices to spike, and putting a rocket under many commodity markets. For context, this sum is equivalent to more than the annual GDPs of the US and Europe combined.
We use the term “global liquidity” to emphasise that money is both international and also embraces wholesale-based credit-providers (the so-called “shadow” banks) that lie beyond the traditional, regulated high-street banks. This pool of fast-moving and footloose funds will again break records in 2021, fuelled by even more central bank quantitative easing (QE) as policy makers accommodate their continuing large fiscal (government spending) programmes (see page 18). In fact, global liquidity looks set to test $180trn, or close to 200% of world GDP, having doubled as a share of GDP within the last two decades.
Macro-valuation shifts triggered by these swings in global liquidity drive asset prices. In other words, money moves markets. Although finance textbooks teach us that the value of a given asset is strictly determined by its expected future earnings, this is not entirely true. Total assets also have to match future expected liabilities in both size and timing. The hunt for assets to hedge liabilities is partly the result of increasing regulation and comes partly from the demands of pension trustees. Since holding cash does not do the trick, investors have to actively invest their excess liquidity in assets whose future values will at least cover these expected liabilities. This means that equities tend to be favoured in periods of rapid economic growth; “real” assets (such as gold and other commodities) are in strong demand during inflationary times; and bonds excel during periods of low inflation.
MoneyWeek
Subscribe to MoneyWeek today and get your first six magazine issues absolutely FREE

Sign up to Money Morning
Don't miss the latest investment and personal finances news, market analysis, plus money-saving tips with our free twice-daily newsletter
Don't miss the latest investment and personal finances news, market analysis, plus money-saving tips with our free twice-daily newsletter
Global markets are not as bubbly as you think
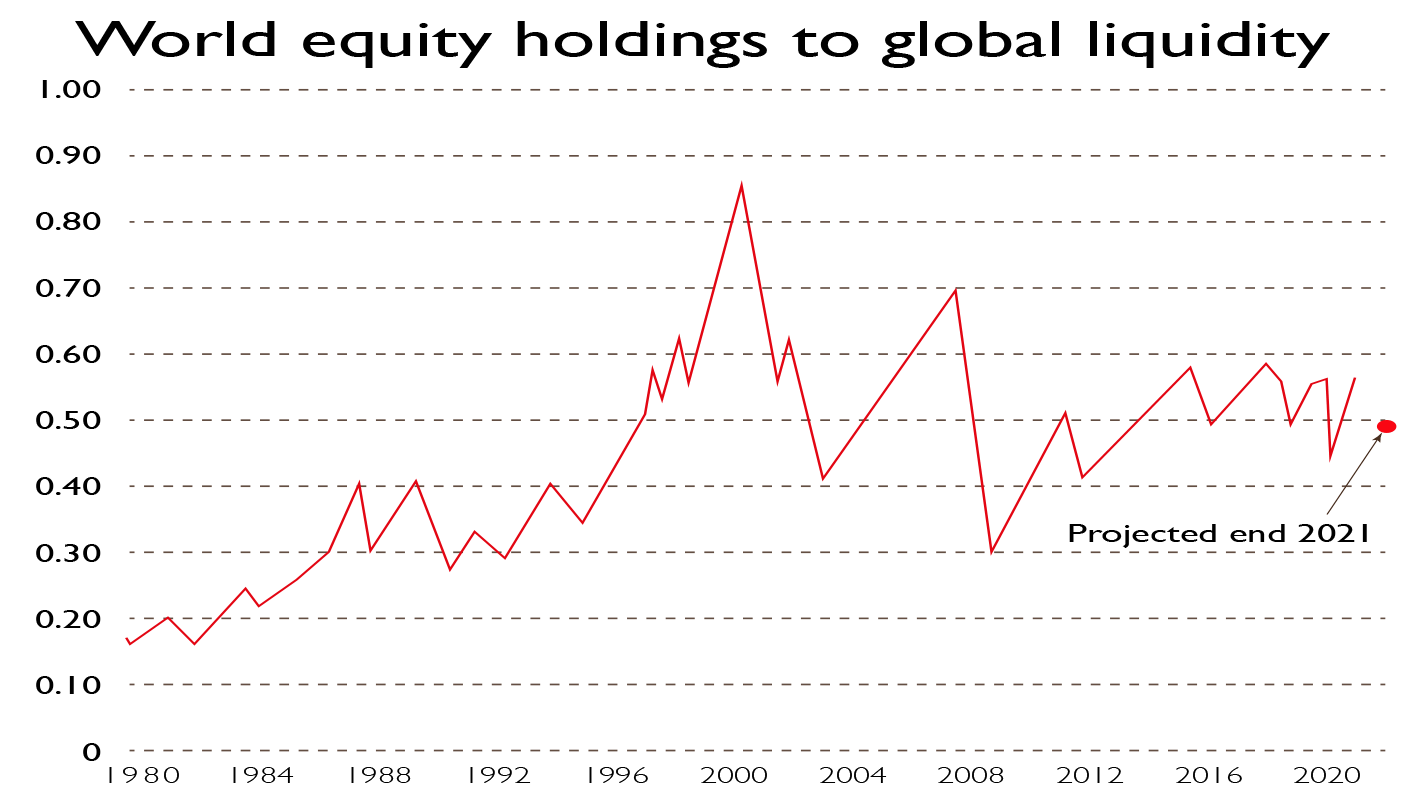
Another way to understand the importance of these “top down” asset allocation decisions is to plot the ratio between all investors’ equity holdings and the pool of global liquidity. We show this ratio, which averages around 0.5 times over the long-term, in the chart above. Although it is currently sitting slightly above this long-term level of 0.5, note that the ratio remains well-below its previous bubble peaks (in 2000 it hit 0.85 times, and in 2008, 0.71). What’s more, with the projected rise in global liquidity for this year, the ratio is slated to fall back below this threshold by this coming year-end.
Not only does the liquidity chart tell us that markets collectively are not yet in bubble territory (certainly compared to the most recent historic bubble events), but, assuming that the global economy returns to growth, it suggests that it may be still worthwhile investing in equities, especially if the latest bond market hiatus triggers further near-term pull-backs.
Drilling down into the global liquidity data shows how China and the US dominate. China’s nest-egg of liquidity, which is especially important to the Asian region and to emerging markets, now stands at an eye-watering $45trn and exceeds America’s pot; only a decade ago it stood at barely $13trn. What’s more, much is seemingly lying idle, because Chinese investors have an equity/liquidity ratio of just 0.2 times. The US equivalent now stands at 1.13 times, or nearly one-third above its long-term average. In short, non-US markets look the better deal. The UK stockmarket stands out as particularly attractive, with an equity-to-liquidity ratio of 0.54 times, and in a mirror-image of Wall Street, almost one-third below its long-term average.
The money simply has to keep flowing
All feasts eventually end. So, looking further ahead, should more cautious investors be thinking about investing elsewhere? Surely at some stage this liquidity surge must reverse when central banks change course? Not so fast. Although we cannot deny that markets move in cycles, we have to consider just how significantly the world has changed following the build-up of private and public debts in recent times. Worldwide, indebtedness will exceed $230trn this year. This is more than two-and-a-half times global GDP, and has virtually doubled since the 2007-2008 global financial crisis.
Worryingly, the enormous scale of these debts may have already enslaved policymakers, who are understandably now more cautious about raising interest rates. Moreover, because debts have limited terms of as little as one, three or five years, and must be re-financed (“rolled over”), central banks may be forced to leave their money taps running for far longer. In a world dominated by the rollover of these huge outstanding debts, financial markets have become large-scale re-financing mechanisms, rather than simply sources of new money for new capital projects.
These re-financing demands mean that crises could occur when funding stops or even slows. Put another way, “balance sheet capacity” – ie, liquidity – is now far more important than the level of interest rates – ie, the cost of capital. This makes continued central bank QE both vital and probably inevitable – which as inflation is the likely result, may in turn be good news for gold.
• Investment advisory CrossBorder Capital specialises in the understanding and tracking of money flows around the world. For more see crossbordercapital.com
Get the latest financial news, insights and expert analysis from our award-winning MoneyWeek team, to help you understand what really matters when it comes to your finances.
Michael Howell is founder and CEO of CrossBorder Capital, which specialises in the understanding and tracking of money flows around the world. For more see crossbordercapital.com
-
 Average UK house price reaches £300,000 for first time, Halifax says
While the average house price has topped £300k, regional disparities still remain, Halifax finds.
-
 Barings Emerging Europe trust bounces back from Russia woes
Barings Emerging Europe trust has added the Middle East and Africa to its mandate, delivering a strong recovery, says Max King
-
 Barings Emerging Europe trust bounces back from Russia woes
Barings Emerging Europe trust has added the Middle East and Africa to its mandate, delivering a strong recovery, says Max King
-
 How a dovish Federal Reserve could affect you
Trump’s pick for the US Federal Reserve is not so much of a yes-man as his rival, but interest rates will still come down quickly, says Cris Sholto Heaton
-
 Three companies with deep economic moats to buy now
Opinion An economic moat can underpin a company's future returns. Here, Imran Sattar, portfolio manager at Edinburgh Investment Trust, selects three stocks to buy now
-
 Should you sell your Affirm stock?
Affirm, a buy-now-pay-later lender, is vulnerable to a downturn. Investors are losing their enthusiasm, says Matthew Partridge
-
 Why it might be time to switch your pension strategy
Your pension strategy may need tweaking – with many pension experts now arguing that 75 should be the pivotal age in your retirement planning.
-
 Beeks – building the infrastructure behind global markets
Beeks Financial Cloud has carved out a lucrative global niche in financial plumbing with smart strategies, says Jamie Ward
-
 Saba Capital: the hedge fund doing wonders for shareholder democracy
Activist hedge fund Saba Capital isn’t popular, but it has ignited a new age of shareholder engagement, says Rupert Hargreaves
-
 Silver has seen a record streak – will it continue?
Opinion The outlook for silver remains bullish despite recent huge price rises, says ByteTree’s Charlie Morris