Get the latest financial news, insights and expert analysis from our award-winning MoneyWeek team, to help you understand what really matters when it comes to your finances.
You are now subscribed
Your newsletter sign-up was successful
Want to add more newsletters?

Twice daily
MoneyWeek
Get the latest financial news, insights and expert analysis from our award-winning MoneyWeek team, to help you understand what really matters when it comes to your finances.

Four times a week
Look After My Bills
Sign up to our free money-saving newsletter, filled with the latest news and expert advice to help you find the best tips and deals for managing your bills. Start saving today!
Welcome back.
In this week’s magazine, we’re taking a look at central bank digital currencies, (something we’ve talked about recently both in Money Morning and on the MoneyWeek website). An awful lot of countries are experimenting with them and a lot more are talking about it. The implications are enormous – find out more about them here. Elsewhere, Dr Mike Tubbs casts his eye over the biotechnology sector – much in the news these days, of course, but there’s a lot more to the industry than vaccines. Mike picks some of the best ways to invest.
In our podcast this week, Merryn talks to Richard Marwood of Royal London Asset Management about his portfolio and investing style. He manages the Royal London UK Dividend Growth Fund and the Equity Income Fund. He talks about his portfolios, the return of dividends as companies recover from the pandemic; how the UK's best companies are getting snapped up by private equity; and why, even as we move to a renewable-energy future, we'll need Big Oil for some time yet. Listen to their conversation here.
MoneyWeek
Subscribe to MoneyWeek today and get your first six magazine issues absolutely FREE

Sign up to Money Morning
Don't miss the latest investment and personal finances news, market analysis, plus money-saving tips with our free twice-daily newsletter
Don't miss the latest investment and personal finances news, market analysis, plus money-saving tips with our free twice-daily newsletter
This week’s “Too Embarrassed To Ask” video explains hyperinflation – what it is and how it can happen. Watch that here.
Here are the links for this week’s editions of Money Morning and other web stories you may have missed.
- Monday Money Morning: Why woeful US jobs data might spell higher inflation in the near future
- Tuesday Money Morning: Inheritance tax planning: the rules around gifting
- Merryn’s blog: Why ESG investing is becoming the norm
- Web article: America’s largest fuel pipeline has been shut since Friday after a ransomware attack. What’s going on?
- Web article: Here is why inflation will send gold soaring
- Wednesday Money Morning: Is it time to top up on gold? Or should you wait for a better opportunity?
- Thursday Money Morning: Inflation is taking off in the US and markets really don’t like it
- Web article: Elon Musk springs a nasty surprise on bitcoin holders
- Friday Money Morning: Are we nearing the end of the negative bond yield era?
- Web article: No let up in house price rises as new records set
- Web article: How will Joe Biden’s capital gains tax rise affect crypto prices?
Now for the charts of the week.
The charts that matter
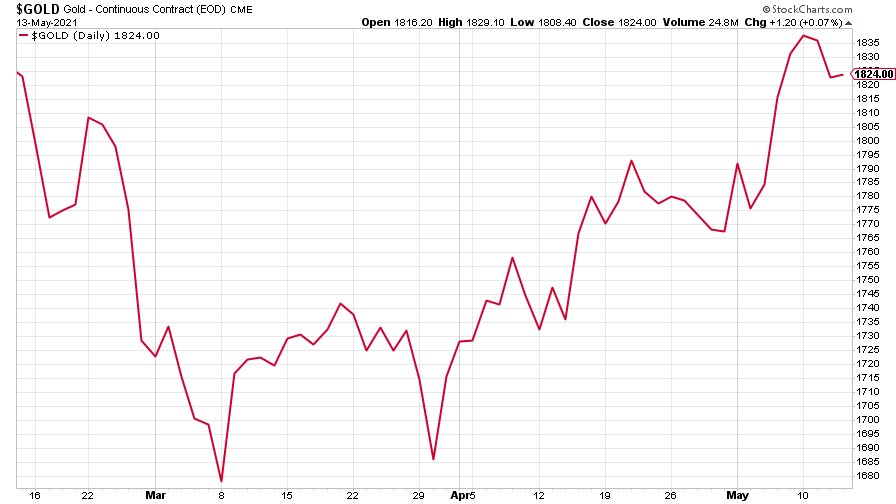
Gold dropped a little , but the trend is up – that could well accelerate if inflation really gets going, as both Saloni and Dominic wrote about this week.
(Gold: three months)
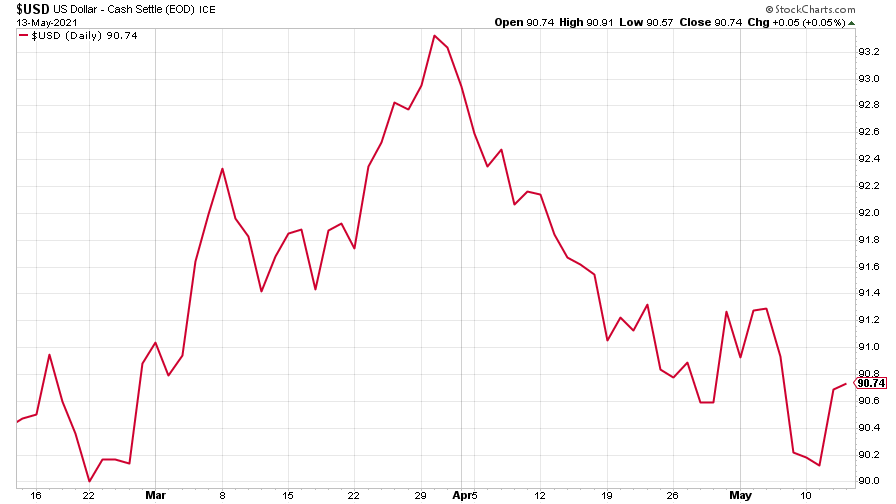
The US dollar index (DXY – a measure of the strength of the dollar against a basket of the currencies of its major trading partners) picked up towards the end of the week, but ended up lower than the previous week.
(DXY: three months)
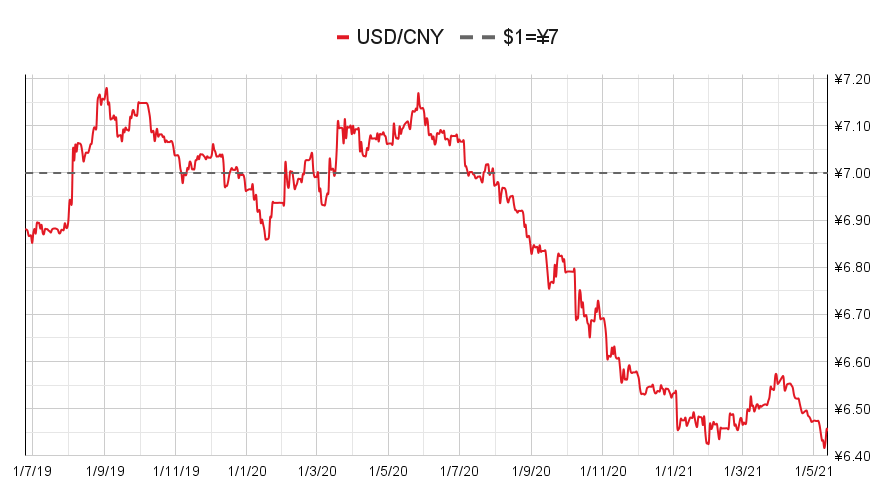
The Chinese yuan (or renminbi) took advantage of dollar weakness (when the red line is rising, the dollar is strengthening while the yuan is weakening).
(Chinese yuan to the US dollar: since 25 Jun 2019)
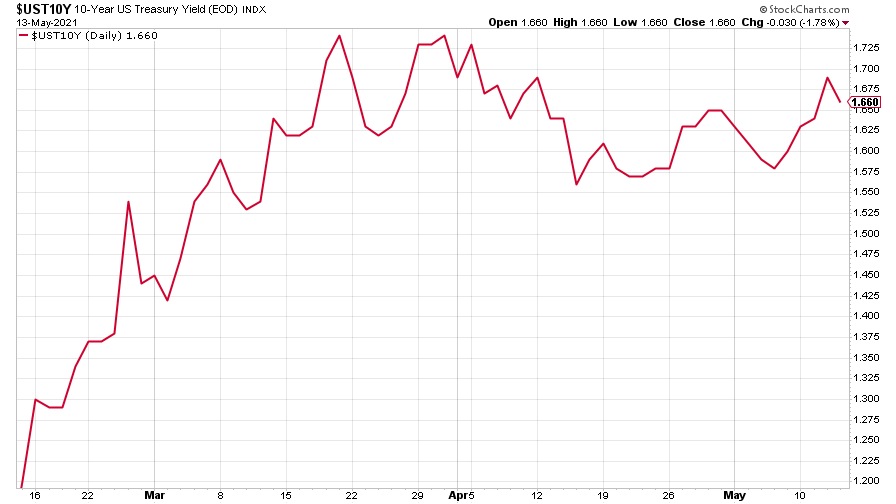
The yield on the ten-year US government bond halted its decline and pushed back up.
(Ten-year US Treasury yield: three months)
The yield on the Japanese ten-year bond also bounced.
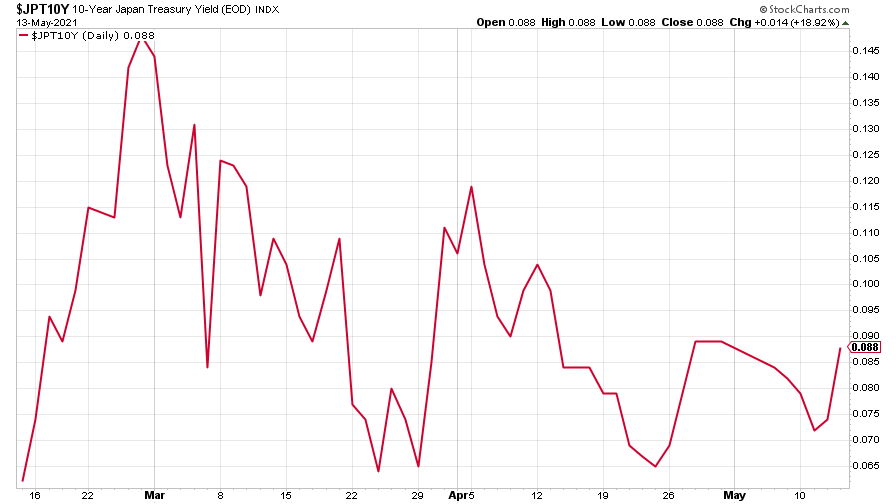
(Ten-year Japanese government bond yield: three months)
And the yield on the ten-year German Bund took a big leap – as John wrote yesterday, we could be looking at the end of negative bond-yield era.
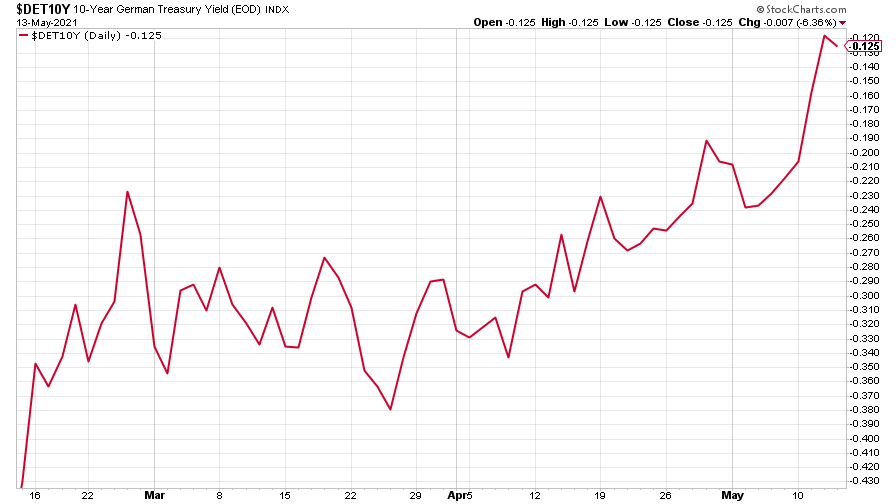
(Ten-year Bund yield: three months)
Copper did what it’s been doing for a long while now - just kept climbing higher.
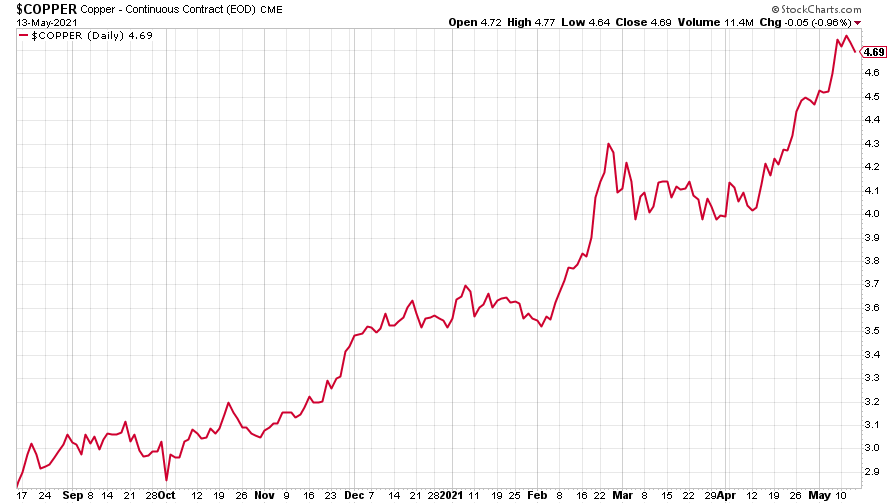
(Copper: nine months)
The closely-related Aussie dollar sold off, however.
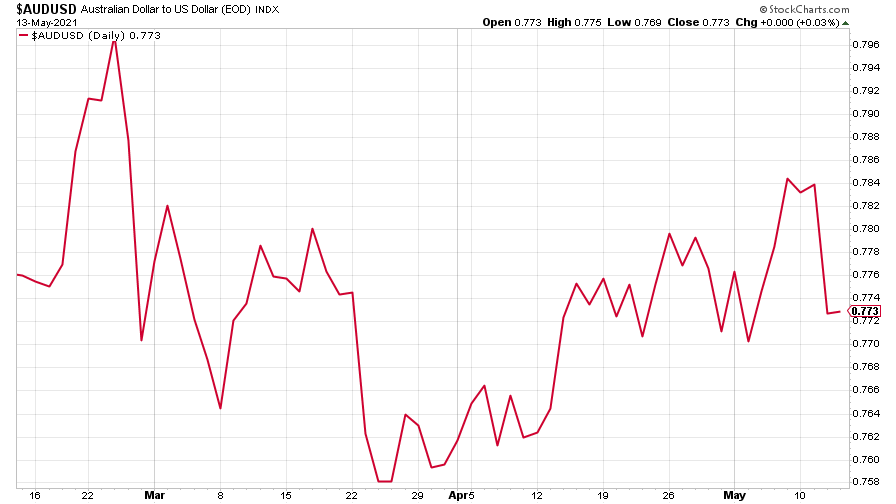
(Aussie dollar vs US dollar exchange rate: three months)
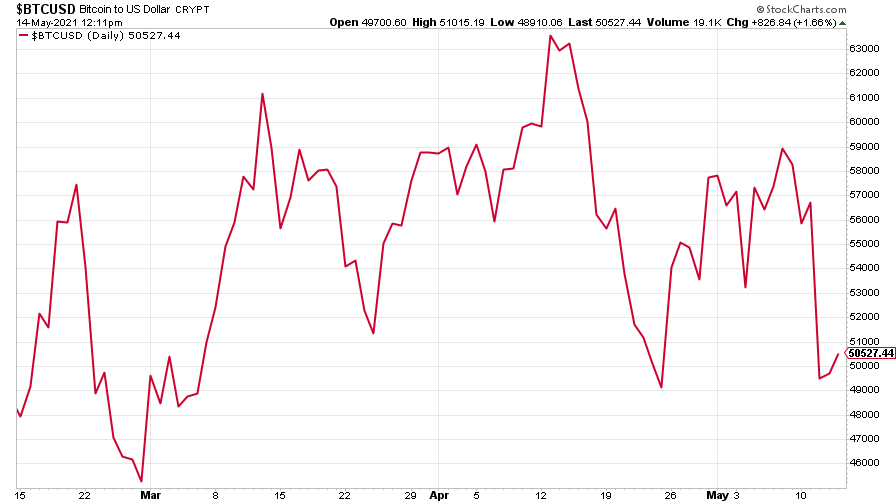
Cryptocurrency bitcoin took an almighty tumble after Elon Musk announced that Tesla wouldn’t in fact be accepting bitcoin as payment for its cars, to the dismay of crypto-fans everywhere.
(Bitcoin: three months)
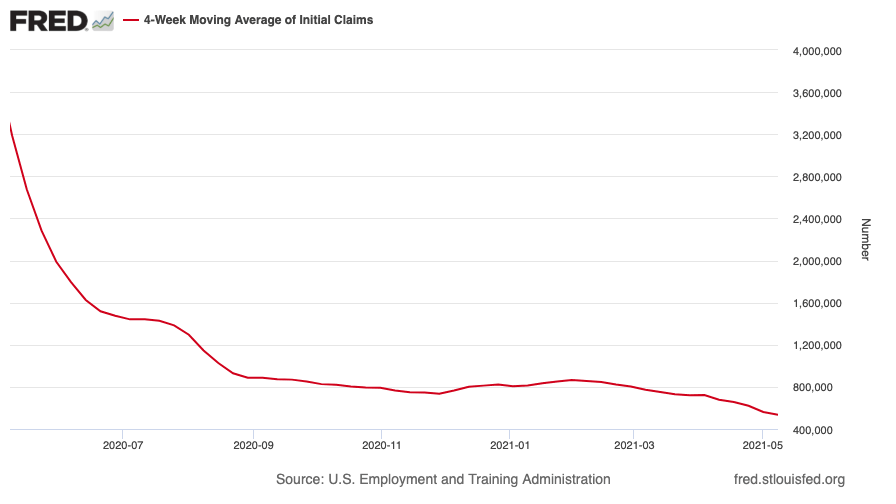
US weekly initial jobless claims continued falling – down 34,000 to 473,000, compared to 507,000 last week (revised up from 498,000). It’s the lowest number of claims since 14 March 2020. The four-week moving average fell to 534,000, down 28,250 from 562,250 (which was revised up from 560,000) the week before. The tightening labour market is one of the factors that could drive inflation higher, reckons John.
(US initial jobless claims, four-week moving average: since Jan 2020)
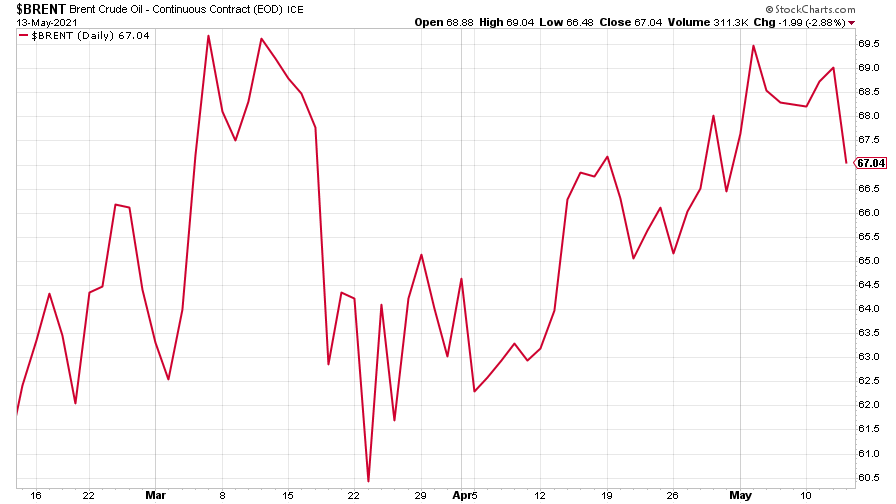
The oil price paused in its recovery.
(Brent crude oil: three months)
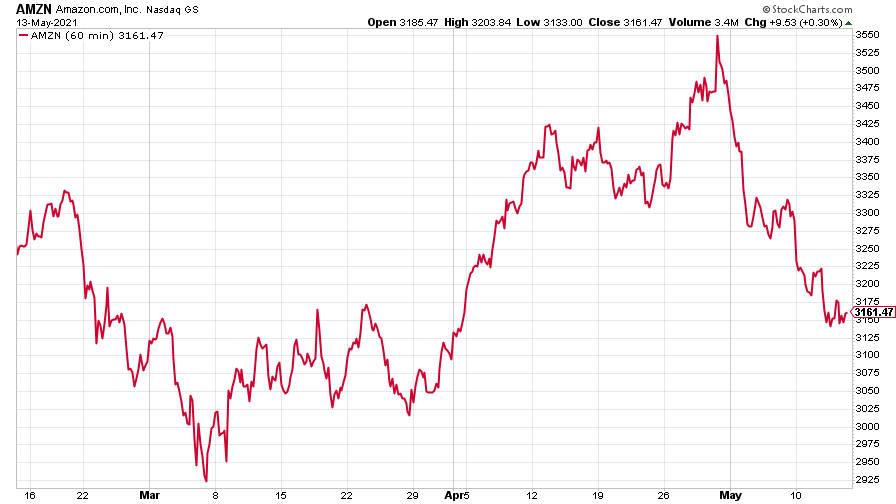
Amazon continued its selloff. US markets, and the tech-heavy Nasdaq in particular, took an almighty fright at the idea that inflation is now back in the US in a serious way.
(Amazon: three months)
Tesla joined the tech rout, too.
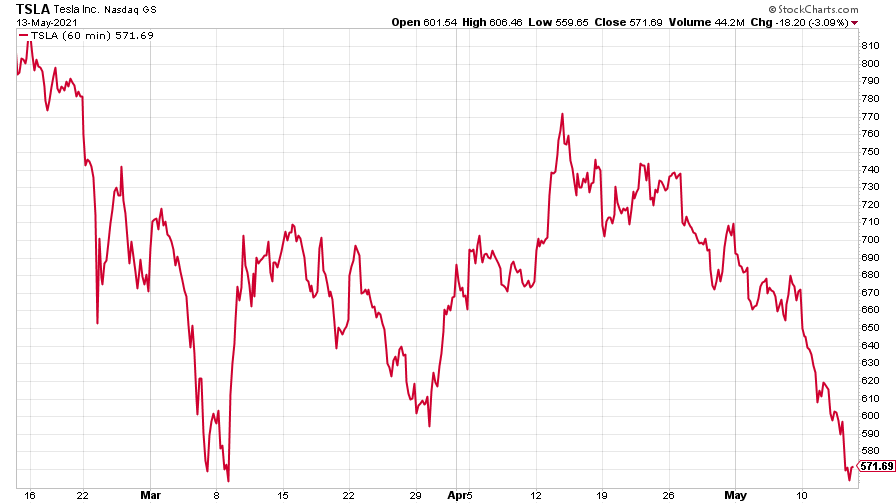
(Tesla: three months)
Have a great weekend.
Ben
Get the latest financial news, insights and expert analysis from our award-winning MoneyWeek team, to help you understand what really matters when it comes to your finances.

-
 RICS: UK housing market showing signs of 'tentative recovery'
RICS members are becoming less negative about property sales and house prices. What does the latest data mean for the property market?
-
 Last chance to invest in VCTs? Here's what you need to know
Investors have pumped millions more into Venture Capital Trusts (VCTS) so far this tax year, but time is running out to take advantage of tax perks from them.
-
 UK wages grow at a record pace
The latest UK wages data will add pressure on the BoE to push interest rates even higher.
-
 Trapped in a time of zombie government
It’s not just companies that are eking out an existence, says Max King. The state is in the twilight zone too.
-
 America is in deep denial over debt
The downgrade in America’s credit rating was much criticised by the US government, says Alex Rankine. But was it a long time coming?
-
 UK economy avoids stagnation with surprise growth
Gross domestic product increased by 0.2% in the second quarter and by 0.5% in June
-
 Bank of England raises interest rates to 5.25%
The Bank has hiked rates from 5% to 5.25%, marking the 14th increase in a row. We explain what it means for savers and homeowners - and whether more rate rises are on the horizon
-
 UK inflation remains at 8.7% ‒ what it means for your money
Inflation was unmoved at 8.7% in the 12 months to May. What does this ‘sticky’ rate of inflation mean for your money?
-
 Would a food price cap actually work?
Analysis The government is discussing plans to cap the prices of essentials. But could this intervention do more harm than good?
-
 Is my pay keeping up with inflation?
Analysis High inflation means take home pay is being eroded in real terms. An online calculator reveals the pay rise you need to match the rising cost of living - and how much worse off you are without it.
