The charts that matter: Yellen’s return injects life into markets
Joe Biden’s pick of Janet Yellen as US treasury secretary has pepped markets up. John Stepek looks at how it’s affected the charts that matter the most to the global economy.

Get the latest financial news, insights and expert analysis from our award-winning MoneyWeek team, to help you understand what really matters when it comes to your finances.
You are now subscribed
Your newsletter sign-up was successful
Want to add more newsletters?

Twice daily
MoneyWeek
Get the latest financial news, insights and expert analysis from our award-winning MoneyWeek team, to help you understand what really matters when it comes to your finances.

Four times a week
Look After My Bills
Sign up to our free money-saving newsletter, filled with the latest news and expert advice to help you find the best tips and deals for managing your bills. Start saving today!
Welcome back.
The vaccine-inspired rally and “great rotation” have continued this week. But how could this relief rally turn into a longer-term “Roaring ‘20s”? That’s our focus in this week’s issue of MoneyWeek. If you don’t already subscribe, click here to get your first six issues free.
On the podcast front we’ve spoiled you again with two real heavy-hitters in the fund management world. First Merryn spoke to Stephen Yiu of the very popular Blue Whale Growth Fund, which I imagine quite a few of you own. They discuss the case for active management, how to get rid of the huge number of terrible funds out there, and Stephen gives us his tips on how he runs an incredibly focused portfolio. Listen to it here.
MoneyWeek
Subscribe to MoneyWeek today and get your first six magazine issues absolutely FREE

Sign up to Money Morning
Don't miss the latest investment and personal finances news, market analysis, plus money-saving tips with our free twice-daily newsletter
Don't miss the latest investment and personal finances news, market analysis, plus money-saving tips with our free twice-daily newsletter
Then Merryn had a conversation with Barry Norris of Argonaut Capital. To say that Norris hasn’t bought into the vaccine excitement is an understatement – he’s shorting them. To find out why (and to hear Merryn’s tremendous rant about shoddy new-build homes), check out the podcast here.
Are you bamboozled by the stockmarket’s obsession with “bulls and bears”? Our latest “Too Embarrassed To Ask” video explains exactly what the terms mean – and tries to shed some light on where they originally come from. Click here to watch.
Here are the links for this week’s editions of Money Morning and other web stories you may have missed.
- Monday: The best dividend recovery plays in the UK right now
- Merryn’s blog: Vaccines, value investing and UK stocks
- Tuesday: Thinking of buying a home? Here’s what you need to know about house prices
- Wednesday: The commodity-dependent slice of the economic pie is shrinking – here’s why
- Thursday: A weakening US dollar is good news for markets – but will it continue?
- Friday: Buy oil – we’re going to be reliant on it for a while yet
Now for the charts of the week.
The charts that matter
After a rough couple of weeks, gold is bouncing back. A slide in the US dollar combined with signs that investors are starting to believe that inflation might be a genuine risk/opportunity for next year, appears to have driven the rally this week.
Why the change of heart? Arguably the trigger is Joe Biden’s confirmation that he wants Janet Yellen, former boss of the Federal Reserve, to be US treasury secretary. That’s about as clear an indicator of intent as you could get – central bankers have been complaining for years that they want governments to take advantage of low interest rates to boost public spending. Now one of those self-same central bankers is taking the reins at the US Treasury. No wonder gold has bounced.
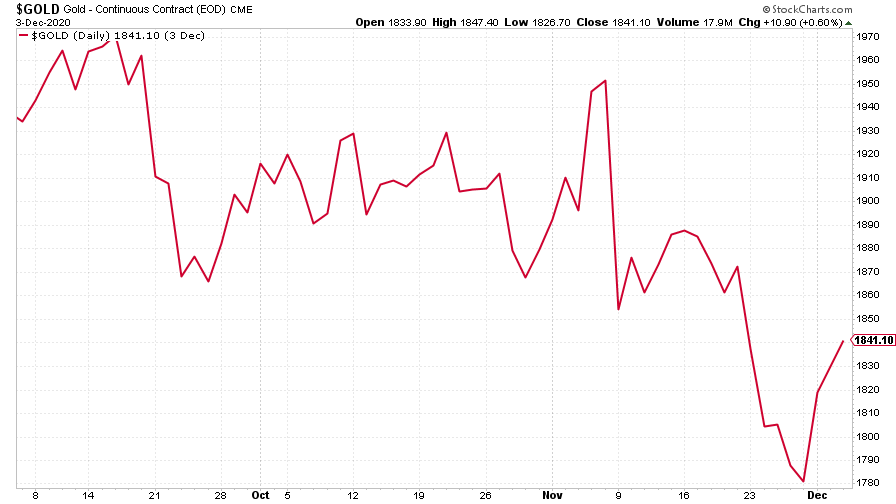
(Gold: three months)
Meanwhile the US dollar index (DXY – a measure of the strength of the dollar against a basket of the currencies of its major trading partners) fell hard. After a long period of “ranging” it does seem as though the US currency has embarked on a new downward trend. We’ll see whether that lasts, but if it does, it’d be good news for risk assets.
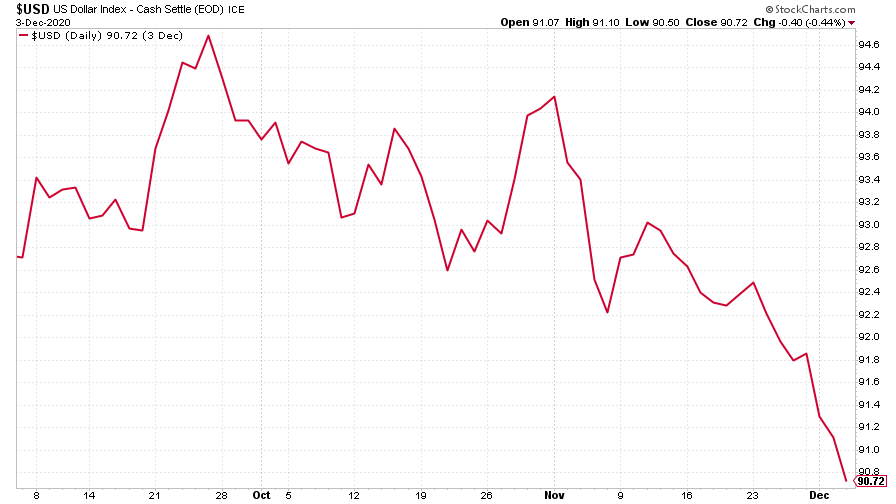
(DXY: three months)
Unsurprisingly, the sliding dollar meant that the Chinese yuan (or renminbi) got even stronger against the US currency this week (when the black line below rises, it means the yuan is getting weaker vs the dollar). It’s now at its strongest level in two-and-a-half years.
China does seem content with a stronger currency right now. This relaxed attitude might be part of China’s longer-term goal to establish the yuan as a reserve currency to rival the dollar, or it might just be a useful way to snap up more commodities on the cheap. Or maybe it’s both.
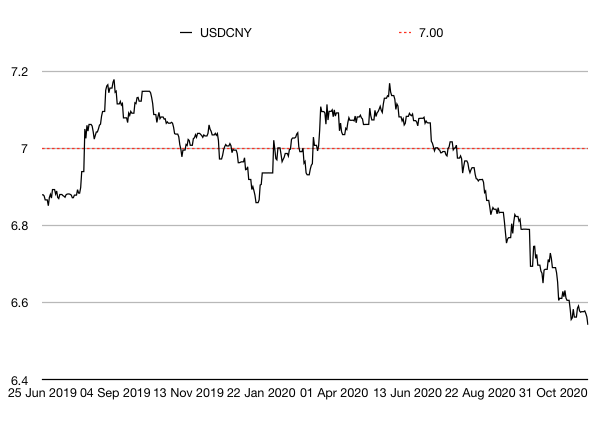
(Chinese yuan to the US dollar: since 25 Jun 2019)
The yield on the ten-year US government bond perked up again this week as investors started to believe the inflation argument. From a technical (charting) point of view, the move is starting to look significant. That could have very wide-ranging implications for broader markets if it continues.
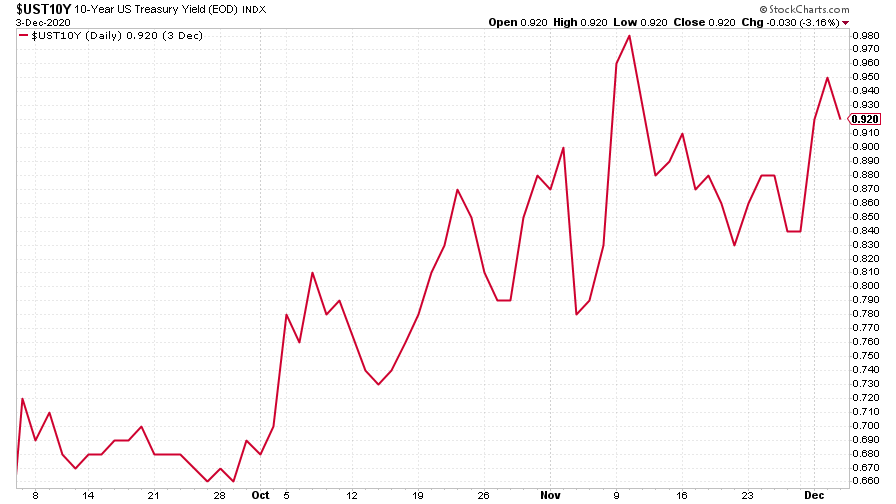
(Ten-year US Treasury yield: three months)
The yield on the Japanese ten-year is pretty much explicitly pinned to zero by the Japanese central bank, which may be something that the Federal Reserve eventually has to do should borrowing costs rise too far in the US.
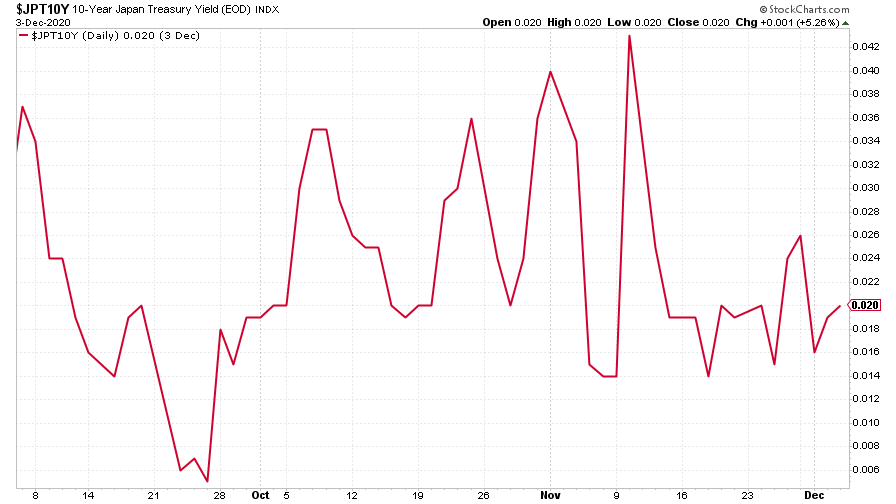
(Ten-year Japanese government bond yield: three months)
The yield on the ten-year German Bund moved somewhat higher as well, reflecting the move in US Treasuries.
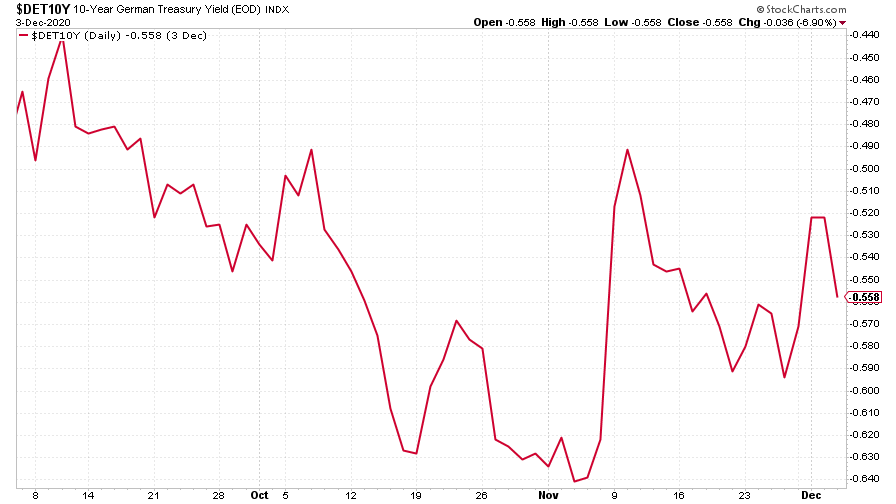
(Ten-year Bund yield: three months)
Copper had a belter of a week, again, maintaining its record as the one asset I really, really wish I’d bought on the day of the lockdown.
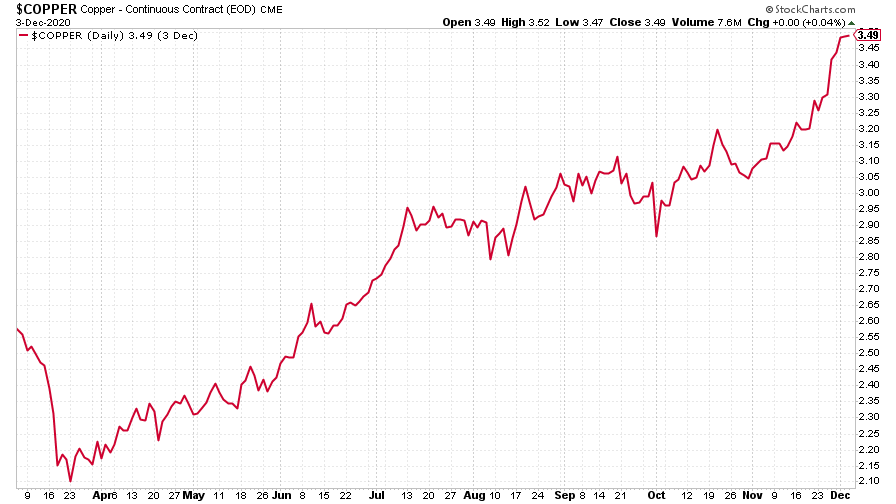
(Copper: nine months)
The Aussie dollar climbed against the US dollar too as investors continue to want to get exposure to commodity currencies.
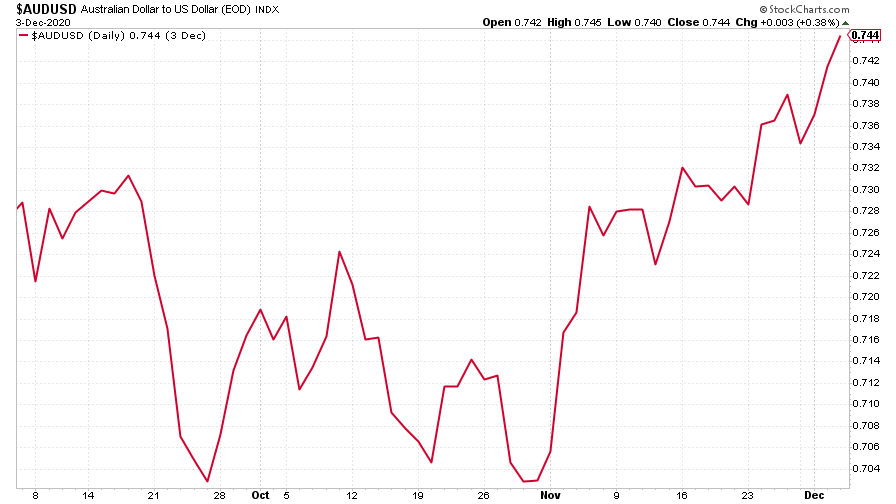
(Aussie dollar vs US dollar exchange rate: three months)
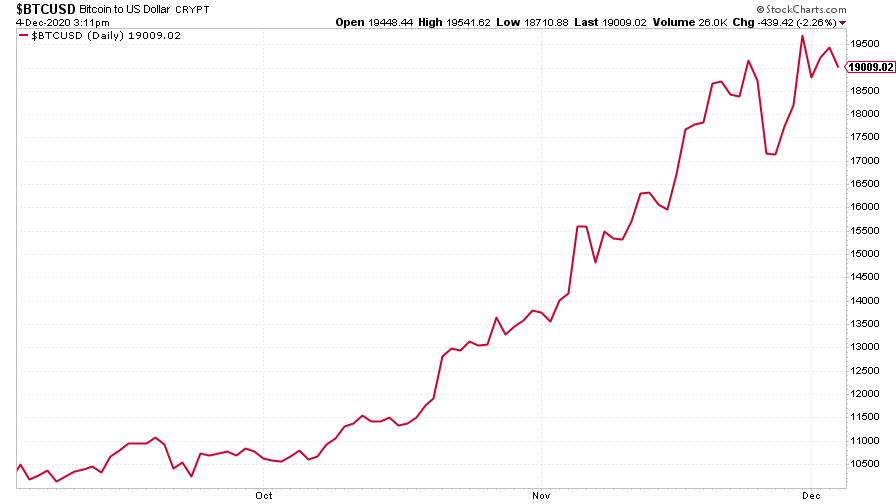
Cryptocurrency bitcoin recovered from its swoon last week and had another crack at its all-time record. My gut feeling is that its persistence will probably pay off – there isn’t the same level of hysteria around it now as there was three years ago. I have no idea how high it will get this time but I’ll be watching with all due fascination.
(Bitcoin: three months)
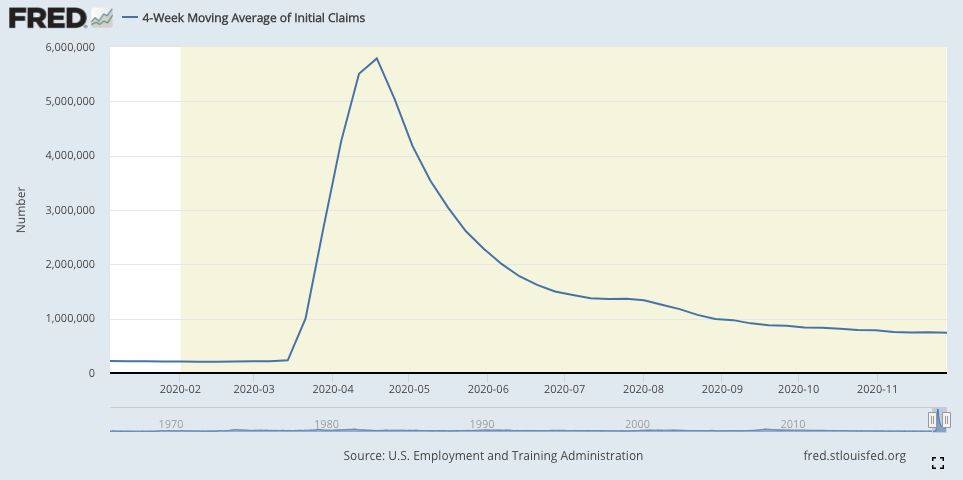
US weekly jobless claims fell to 712,000, from 787,000 last week (revised up from 778,000), and better than expected. The four-week moving average dipped to 739,500 from 750,750 the week before.
The more closely-watched monthly non-farm payrolls revealed that the US economy added just 245,000 jobs last month, a good deal less than the 470,000 expected. The data probably needs to be taken with a pinch of salt either way – there’s still a lot of disruption – but arguably it only adds to the argument for boosting public spending and going easy on interest rates, so markets may feel inclined to take it as good news.
(US jobless claims, four-week moving average: since Jan 2020)
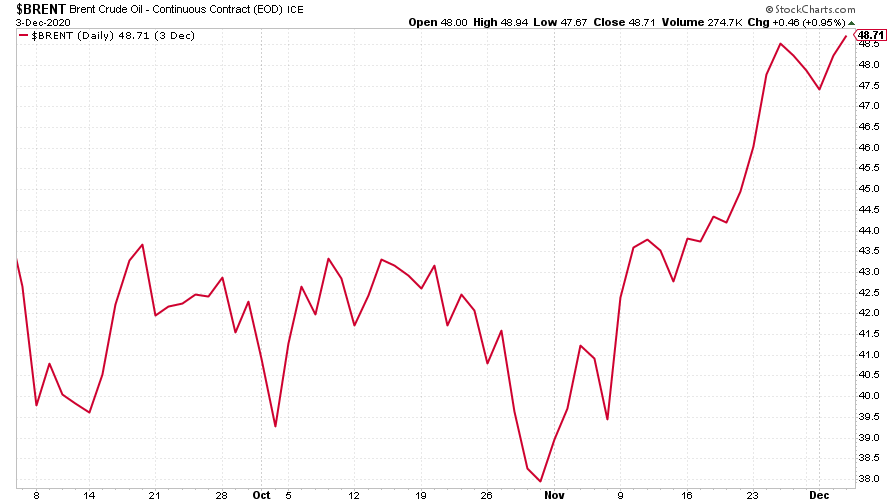
The oil price (as measured by Brent crude) continued to gain ground, hitting another fresh post-Covid high this week.
(Brent crude oil: three months)
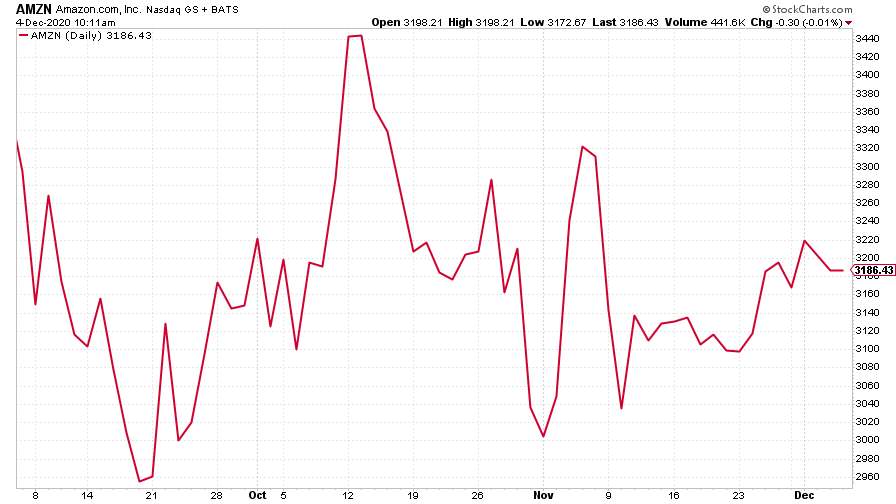
Amazon is one of the few companies whose share price has spent most of the time meandering around since the vaccine news came out. At the end of the day, it’s done well from lockdown, so if you’re looking to profit from the rebound rally, it’s hardly going to top your list of candidates. On a longer-term note, Amazon and Big Tech in general have benefited from the low interest rate environment. If that changes – and if Yellen and the vaccine get their way it might – then the leading stocks of the past decade or more could well turn into the laggards.
(Amazon: three months)
Tesla meanwhile just keeps hitting new highs. What can I say? I am curious to see if entering the S&P 500 will mark the peak for this boom (companies do tend to underperform once they get promoted, which in most cases is probably just an artefact of them being overbought on the promotion news in the first place). Not long to wait – it joins the index on December 21st – could 2021 be the year that Tesla’s bubble finally pops?
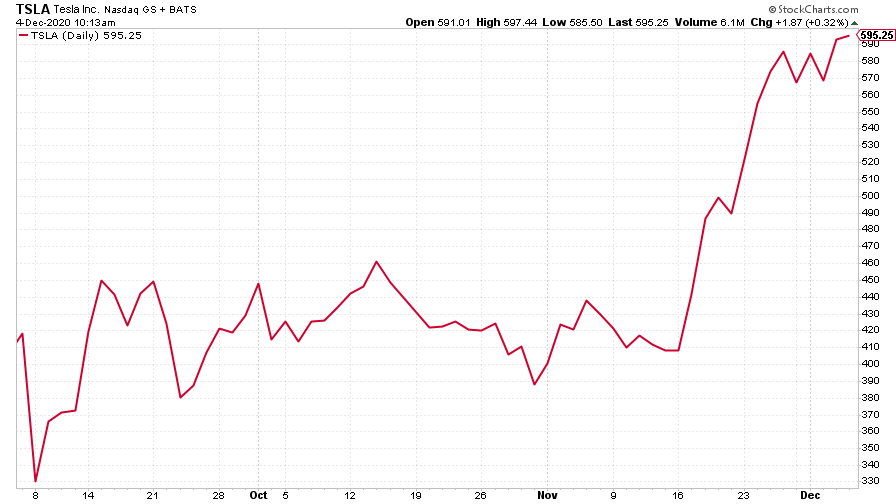
(Tesla: three months)
Have a great weekend.
Get the latest financial news, insights and expert analysis from our award-winning MoneyWeek team, to help you understand what really matters when it comes to your finances.

-
 Average UK house price reaches £300,000 for first time, Halifax says
While the average house price has topped £300k, regional disparities still remain, Halifax finds.
-
 Barings Emerging Europe trust bounces back from Russia woes
Barings Emerging Europe trust has added the Middle East and Africa to its mandate, delivering a strong recovery, says Max King
-
 UK wages grow at a record pace
The latest UK wages data will add pressure on the BoE to push interest rates even higher.
-
 Trapped in a time of zombie government
It’s not just companies that are eking out an existence, says Max King. The state is in the twilight zone too.
-
 America is in deep denial over debt
The downgrade in America’s credit rating was much criticised by the US government, says Alex Rankine. But was it a long time coming?
-
 UK economy avoids stagnation with surprise growth
Gross domestic product increased by 0.2% in the second quarter and by 0.5% in June
-
 Bank of England raises interest rates to 5.25%
The Bank has hiked rates from 5% to 5.25%, marking the 14th increase in a row. We explain what it means for savers and homeowners - and whether more rate rises are on the horizon
-
 UK inflation remains at 8.7% ‒ what it means for your money
Inflation was unmoved at 8.7% in the 12 months to May. What does this ‘sticky’ rate of inflation mean for your money?
-
 Would a food price cap actually work?
Analysis The government is discussing plans to cap the prices of essentials. But could this intervention do more harm than good?
-
 Is my pay keeping up with inflation?
Analysis High inflation means take home pay is being eroded in real terms. An online calculator reveals the pay rise you need to match the rising cost of living - and how much worse off you are without it.