The charts that matter: central banks just keep printing
Central banks made it clear this week that they will support markets with more printed money. John Stepek looks at how that's affected the charts that matter most to the global economy.

Get the latest financial news, insights and expert analysis from our award-winning MoneyWeek team, to help you understand what really matters when it comes to your finances.
You are now subscribed
Your newsletter sign-up was successful
Want to add more newsletters?

Twice daily
MoneyWeek
Get the latest financial news, insights and expert analysis from our award-winning MoneyWeek team, to help you understand what really matters when it comes to your finances.

Four times a week
Look After My Bills
Sign up to our free money-saving newsletter, filled with the latest news and expert advice to help you find the best tips and deals for managing your bills. Start saving today!
Welcome back. We have a slick new look this week. Hopefully you should now find that the charts are easier on the eye.
And a quick reminder – if you don’t already subscribe to MoneyWeek, now’s the time to do so, before all the real excitement starts…
Sign up now to get your first six issues free plus an e-book about previous booms and busts. Subscribe here now.
MoneyWeek
Subscribe to MoneyWeek today and get your first six magazine issues absolutely FREE

Sign up to Money Morning
Don't miss the latest investment and personal finances news, market analysis, plus money-saving tips with our free twice-daily newsletter
Don't miss the latest investment and personal finances news, market analysis, plus money-saving tips with our free twice-daily newsletter
Here are the links for this week’s editions of Money Morning.
- Monday: Watch out income investors – BP looks likely to cut its dividend in the near future
- Tuesday: How to use investment trusts to invest in specific countries and themes
- Merryn’s blog: UK house prices holding up as city folk flock to the country
- Wednesday: Believe it or not, this market is a “buy”
- Thursday: A year’s worth of inflation in a single month
- Friday: The US stockmarket is a bubble. So is it time to sell?
We have a nice, short podcast for you this week – Merryn and I had a chat about share price valuations (US is expensive, but quite a few other markets are quite cheap), inflation, and V-shaped recoveries. Check it out here.
And I got another very nice review for my book, The Sceptical Investor, which in the interests of blatant self-promotion, I feel compelled to share with you immediately. “It is an easy read and provides a lot of information about the influence of behavioural economics on investing. It also has several, good practical steps that an investor can follow in order to mitigate risk. This is definitely a book worth purchasing and one that I will be coming back to in the future. Highly recommended.”
Made my week, that one did. If you fancy buying it, you can get the audio book here, or the print/ebook version here.
Onto the charts of the week...
The charts that matter
Central banks across the globe tried to make it clear this week that help will continue to be forthcoming to markets, regardless of the underlying pace of recovery. The Bank of England is printing more money, while the Federal Reserve said that it’ll now buy individual corporate bonds. You don’t get much more of an effort to send a positive signal to markets than that.
Yet gold has been in limbo this week. The market can’t decide whether it’s in “risk-on” or “risk-off” mode. Do investors want to pile back into the S&P 500 or do they want to stick with the perceived safety of US Treasuries, the dollar, and to an extent, gold? From a technical point of view (ie watching the charts alone), gold is very close to its all-time dollar high (though well above it in most other currencies) so progress is likely to be sticky. But you should hang on – if we do end up with an inflationary outcome or a financially destabilising one, you’ll be glad you own some.
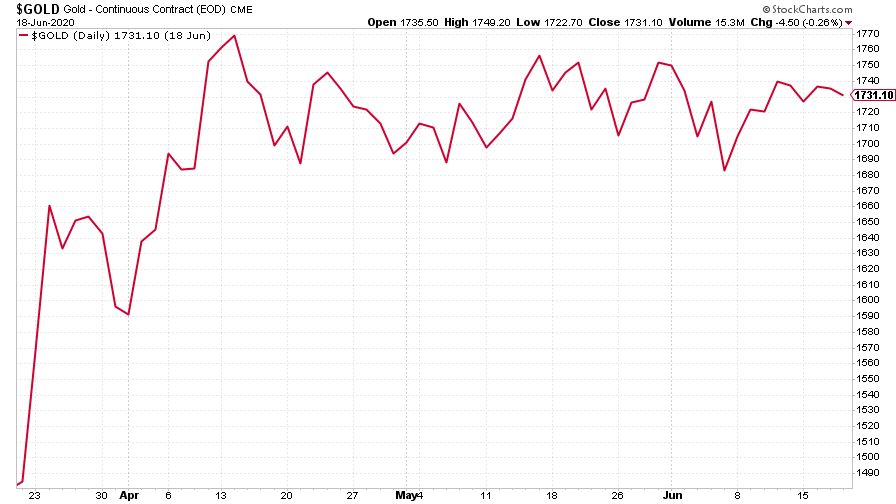
(Gold: three months)
The US dollar index (DXY – a measure of the strength of the dollar against a basket of the currencies of its major trading partners) has shown no such equivocation. It’s been heading higher which is a reliable sign that investors are jittery. Now, to be fair, the dollar index has been falling for a few weeks now and was due a bounce, in much the same way that you can argue the stock market was due a breather. So this might just be a correction. We’ll have to wait and see. But if you’re bullish, you want to see this red line going down.
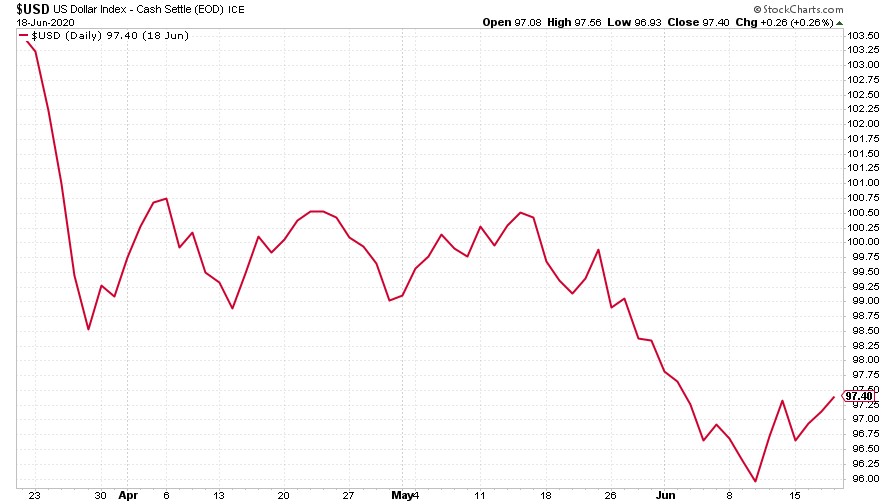
(DXY: three months)
In line with the wider move in the dollar, the Chinese yuan (or renminbi) has weakened a little against the dollar (confusingly, it’s weakening when the black line on the chart below rises). So far that’s not particularly noteworthy given the wider context but it’s worth watching, as tensions between China and the US tend to crop up in the exchange rate first.
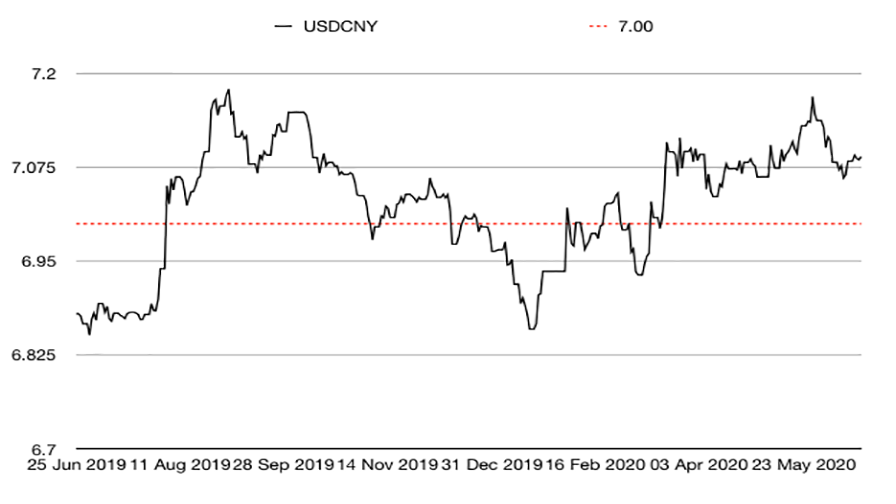
(Chinese yuan to the US dollar: since 25 Jun 2019)
The yield on the ten-year US government bond was little changed this week although it did creep a little higher, suggesting that last week’s post-Fed panicky moment is over.
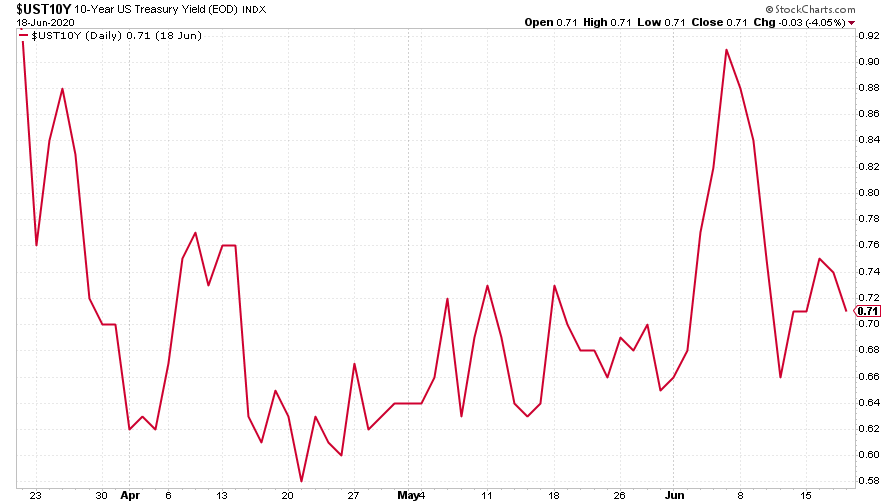
(Ten-year US Treasury yield: three months)
The yield on the Japanese ten-year similarly rose a little, back into positive territory.
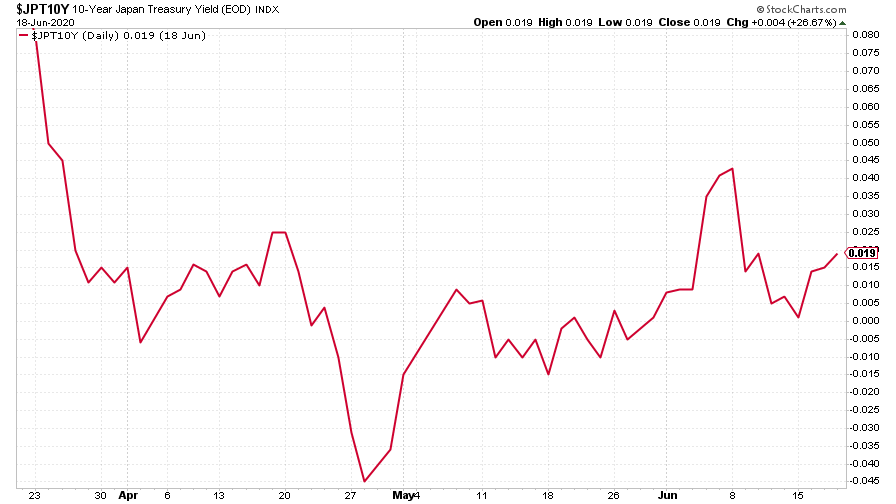
(Ten-year Japanese government bond yield: three months)
The yield on the ten-year German bund however, slipped a little lower. The main issue for eurozone bonds right now is the feasibility or otherwise of a coronavirus bailout package which involves issuing what is effectively joint debt. The negotiations promise to be lengthy and complex, though a deal of some sort does seem likely in the end. (And remember that in the meantime, the European Central Bank is just buying what it likes so spreads – the gaps in the cost of borrowing between the most and least creditworthy eurozone nations – should behave themselves).
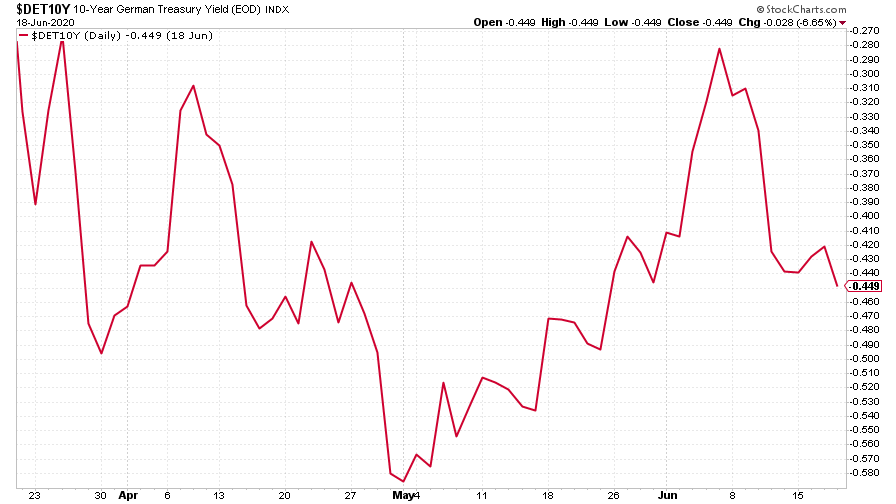
(Ten-year Bund yield: three months)
Copper took a knock last week but recovered its poise. Again it’s had a sharp run-up so the recent jitters might be nothing more than that – just profit-taking.
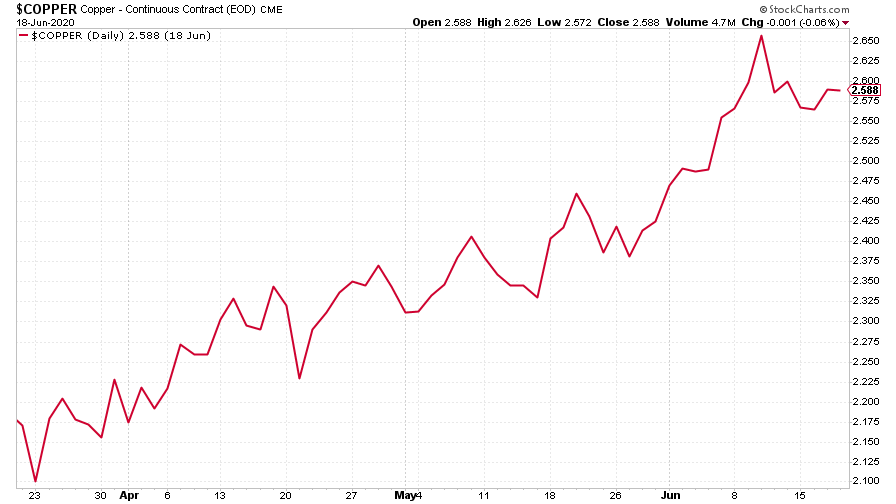
(Copper: three months)
It’s a similar story for the Aussie dollar.
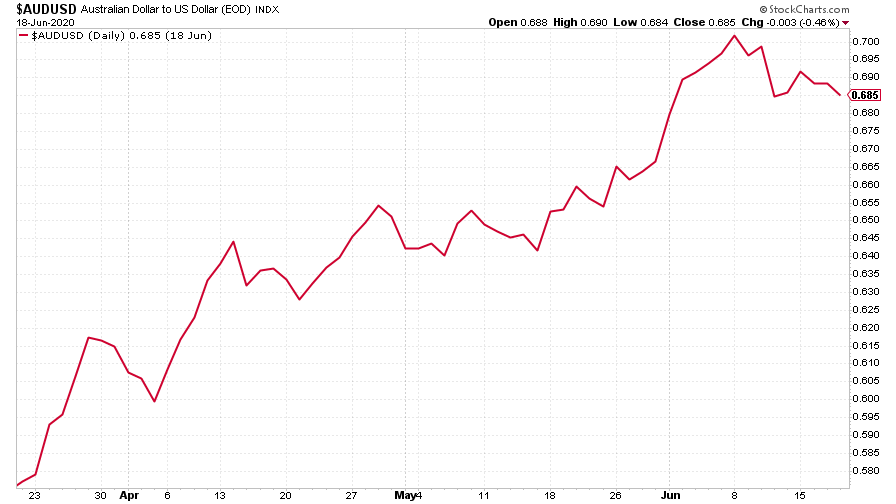
(Aussie dollar vs US dollar exchange rate: three months)
Yet again, cryptocurrency bitcoin remained in its current near-comatose state.
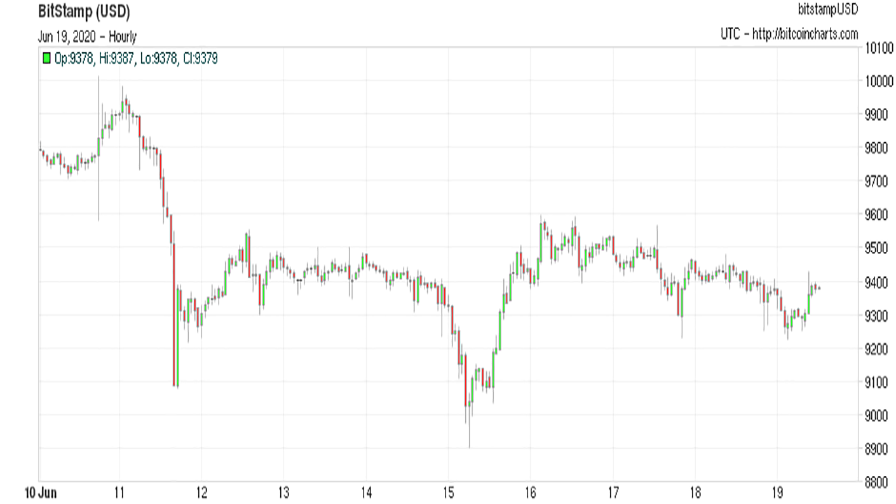
(Bitcoin: ten days)
This week’s US weekly jobless claims figure continued the run of improvements, although barely. It was however, worse than expected. The number of new claims fell to 1.51 million (down from 1.57 million last week, which was revised up from 1.54 million). Economists had expected the figure to come in at 1.3 million. The four-week moving average now sits at 1.77 million, compared to last week’s 2.0 million.
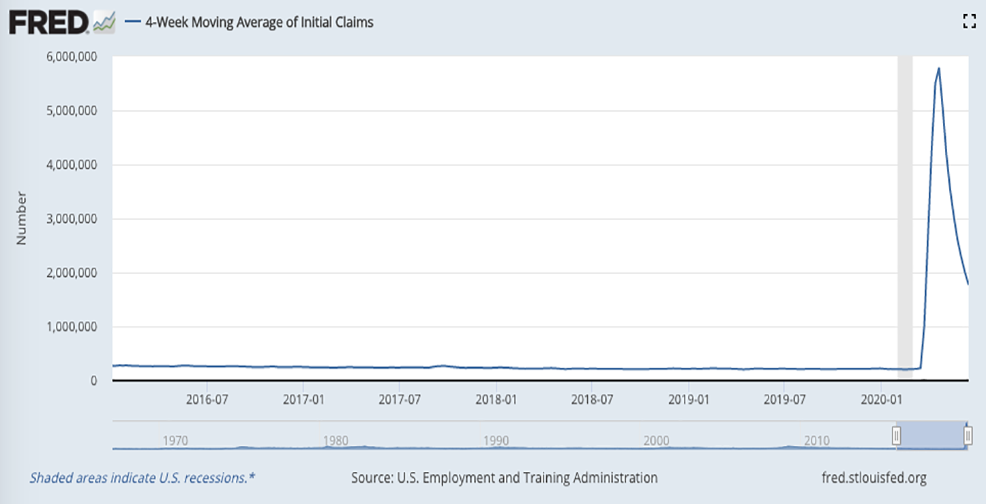
(US jobless claims, four-week moving average: since January 2016)
The oil price rallied as investors continue to come to terms with the fact that while oil might be doomed in the long run, we’re still going to need some of it, and demand might bounce back quite sharply now that people are getting on the road again and even thinking about flying.
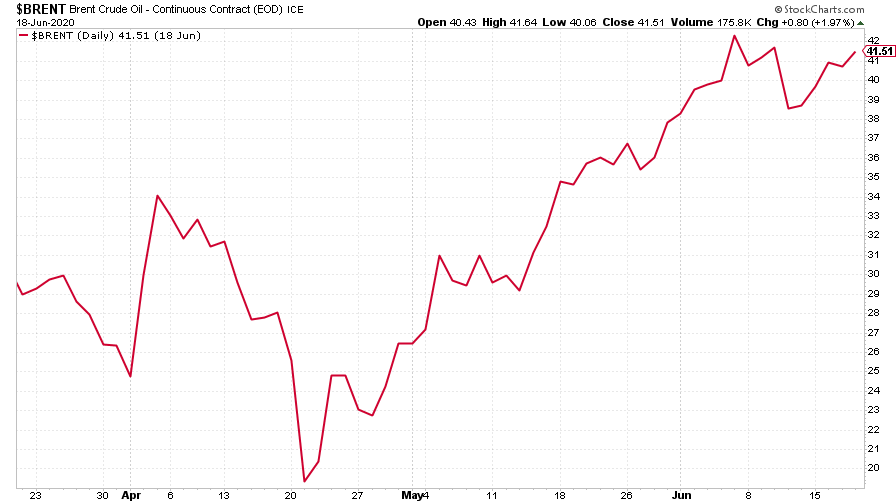
(Brent crude oil: three months)
Amazon had a solid week, rallying sharply from a minor drop last week. One analyst now reckons the shares could end up hitting $5,000 in the long run (though the analysis in question only has a 12-month price target of $3,200). I’m not sure that’s whacky enough these days to count as a proper “top of the market” call (I’d rather see $20,000 or better yet, $100,000 – but it’s certainly enthusiastic.
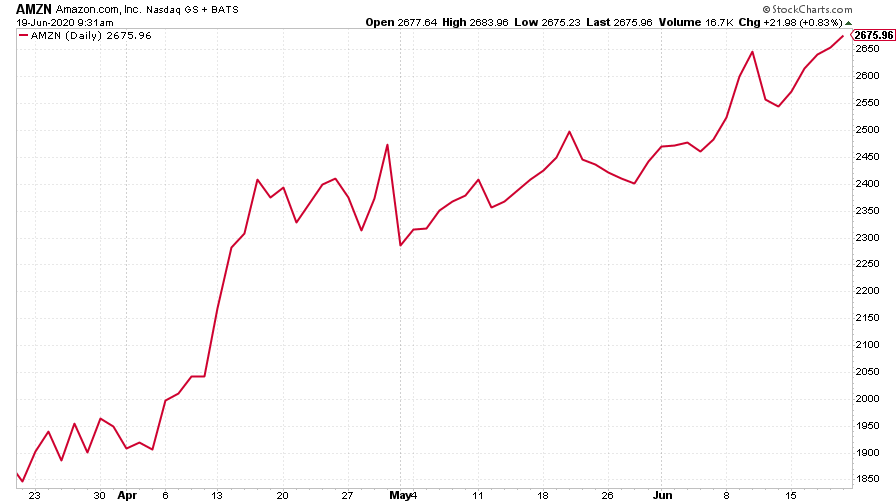
(Amazon: three months)
Electric car group Tesla also saw its share price recovery from last week’s dip. Analysts at Jefferies grabbed a few headlines by sticking a $1,200 price target on the company, double their previous target.
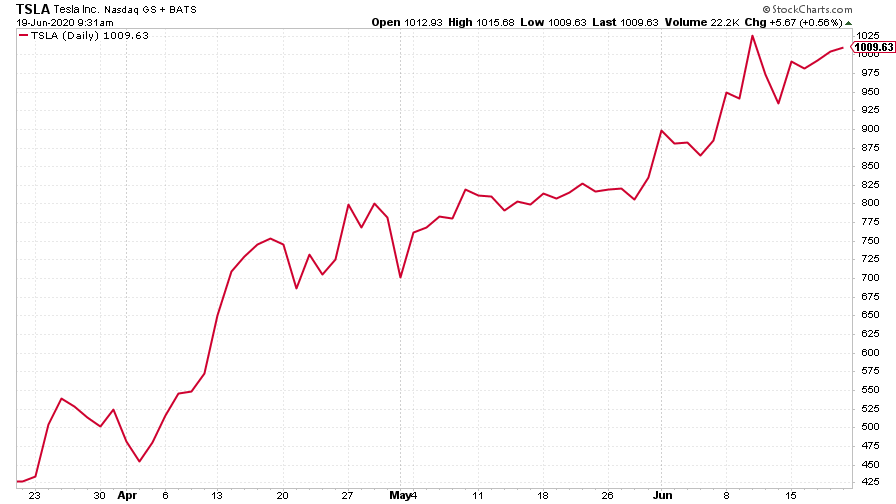
(Tesla: three months)
Have a good weekend.
Get the latest financial news, insights and expert analysis from our award-winning MoneyWeek team, to help you understand what really matters when it comes to your finances.

-
 Average UK house price reaches £300,000 for first time, Halifax says
While the average house price has topped £300k, regional disparities still remain, Halifax finds.
-
 Barings Emerging Europe trust bounces back from Russia woes
Barings Emerging Europe trust has added the Middle East and Africa to its mandate, delivering a strong recovery, says Max King
-
 What's behind the big shift in Japanese government bonds?
Rising long-term Japanese government bond yields point to growing nervousness about the future – and not just inflation
-
 UK wages grow at a record pace
The latest UK wages data will add pressure on the BoE to push interest rates even higher.
-
 Trapped in a time of zombie government
It’s not just companies that are eking out an existence, says Max King. The state is in the twilight zone too.
-
 America is in deep denial over debt
The downgrade in America’s credit rating was much criticised by the US government, says Alex Rankine. But was it a long time coming?
-
 UK economy avoids stagnation with surprise growth
Gross domestic product increased by 0.2% in the second quarter and by 0.5% in June
-
 Bank of England raises interest rates to 5.25%
The Bank has hiked rates from 5% to 5.25%, marking the 14th increase in a row. We explain what it means for savers and homeowners - and whether more rate rises are on the horizon
-
 UK inflation remains at 8.7% ‒ what it means for your money
Inflation was unmoved at 8.7% in the 12 months to May. What does this ‘sticky’ rate of inflation mean for your money?
-
 Would a food price cap actually work?
Analysis The government is discussing plans to cap the prices of essentials. But could this intervention do more harm than good?