Believe it or not, this market is a “buy”
With the world in the state it’s in and the market so volatile, buying stocks right now might go against all your instincts. But that’s just what you should be doing, says Dominic Frisby. Here, he explains why.


Get the latest financial news, insights and expert analysis from our award-winning MoneyWeek team, to help you understand what really matters when it comes to your finances.
You are now subscribed
Your newsletter sign-up was successful
Want to add more newsletters?

Twice daily
MoneyWeek
Get the latest financial news, insights and expert analysis from our award-winning MoneyWeek team, to help you understand what really matters when it comes to your finances.

Four times a week
Look After My Bills
Sign up to our free money-saving newsletter, filled with the latest news and expert advice to help you find the best tips and deals for managing your bills. Start saving today!
You might remember me beating the drum in the spring of 2019 to be buying US stocks, a call I made purely on the grounds of which way the trend was going.
A number of people have written in to ask my current opinion on stocks and, in particular, what my trend-following system is now saying. The short answer is: it’s on a “buy” signal.
That might go instinctively against everything you think about the world at the moment: Covid resurfacing, economies ruined, unemployment about to go ballistic, interracial tension boiling over. How can stocks go up with things as they are?
MoneyWeek
Subscribe to MoneyWeek today and get your first six magazine issues absolutely FREE

Sign up to Money Morning
Don't miss the latest investment and personal finances news, market analysis, plus money-saving tips with our free twice-daily newsletter
Don't miss the latest investment and personal finances news, market analysis, plus money-saving tips with our free twice-daily newsletter
But that’s the whole point about this system. It strips out the noise. It does all the thinking for you. It finds trends and follows them. Nothing else matters.
A simple mechanical stock trading system
You can read about my system in more detail here, but let me quickly explain how it works as well as issuing a couple of disclaimers, before we go on to look at the S&P 500.
The system uses two weekly moving averages, the 21-week and nine-week. The 21-week simple moving average would show the average price of the previous 21 weeks. We use exponential moving averages (EMAs) which give greater weighting to more recent weeks. (It does not make that much difference which you use, to be frank, but I prefer EMAs. You can use shorter timeframes, if you prefer – sometimes I prefer the six-week EMA to the nine, but for longer-term traders the nine-week works well).
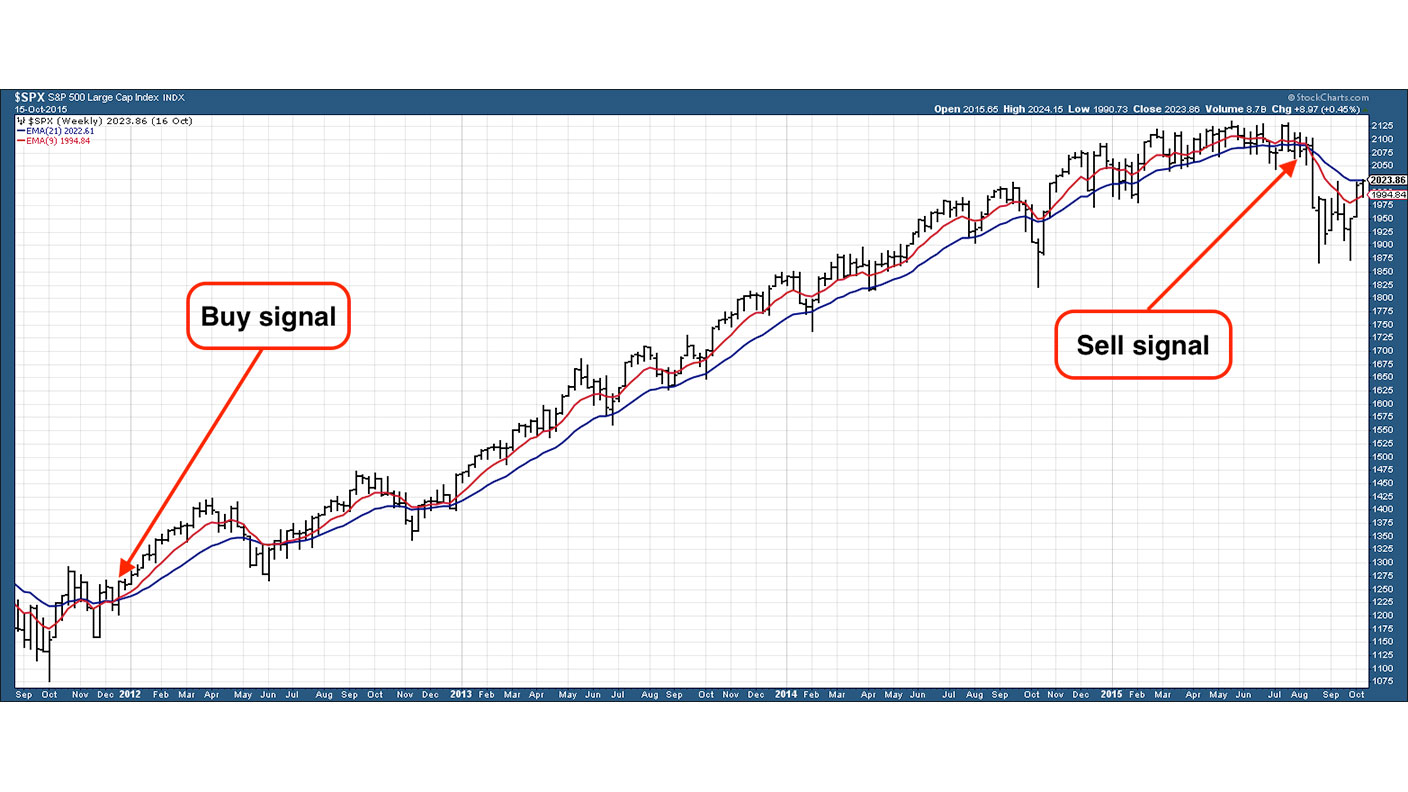
Below, we have a chart of the S&P 500 between 2011 and 2015. In that entire period there was one buy signal and one sell (note: it doesn’t always work this well).

The buy signal occurs when both EMAs are flat or sloping up; when the nine-week EMA (red line) is above the 21-week EMA (blue line); and the price (in black) is above both. The trigger is the point at which the nine-week EMA (red line) crosses up through the 21-week EMA (blue line).
The sell signal is the reverse. When the red line (nine-week EMA) crosses down through the blue line (21-week EMA), and the price is below, that is your cue to sell.
You can see the buy signal in late 2011 with the S&P 500 at 1,250. The sell signal came four years later with the S&P at 2,050. There were a couple of near-misses, particularly in June 2012, but the system kept you long in what turned out to be a great bull market.
I stress that this system only works in trending markets. In markets that are range bound, it will lose you money. What’s more, it doesn’t get you in at the bottom or out at the top. But if a market is trending, it will catch you the large portion of the move.
It is a long-term strategy. You might only get a couple of buy or sell signals a year. Sometimes you don't even get that. It does not suit those who like to look at prices on a daily basis. Rather, it suits those who like to clock in once or twice a week.
Dodging a nasty crash
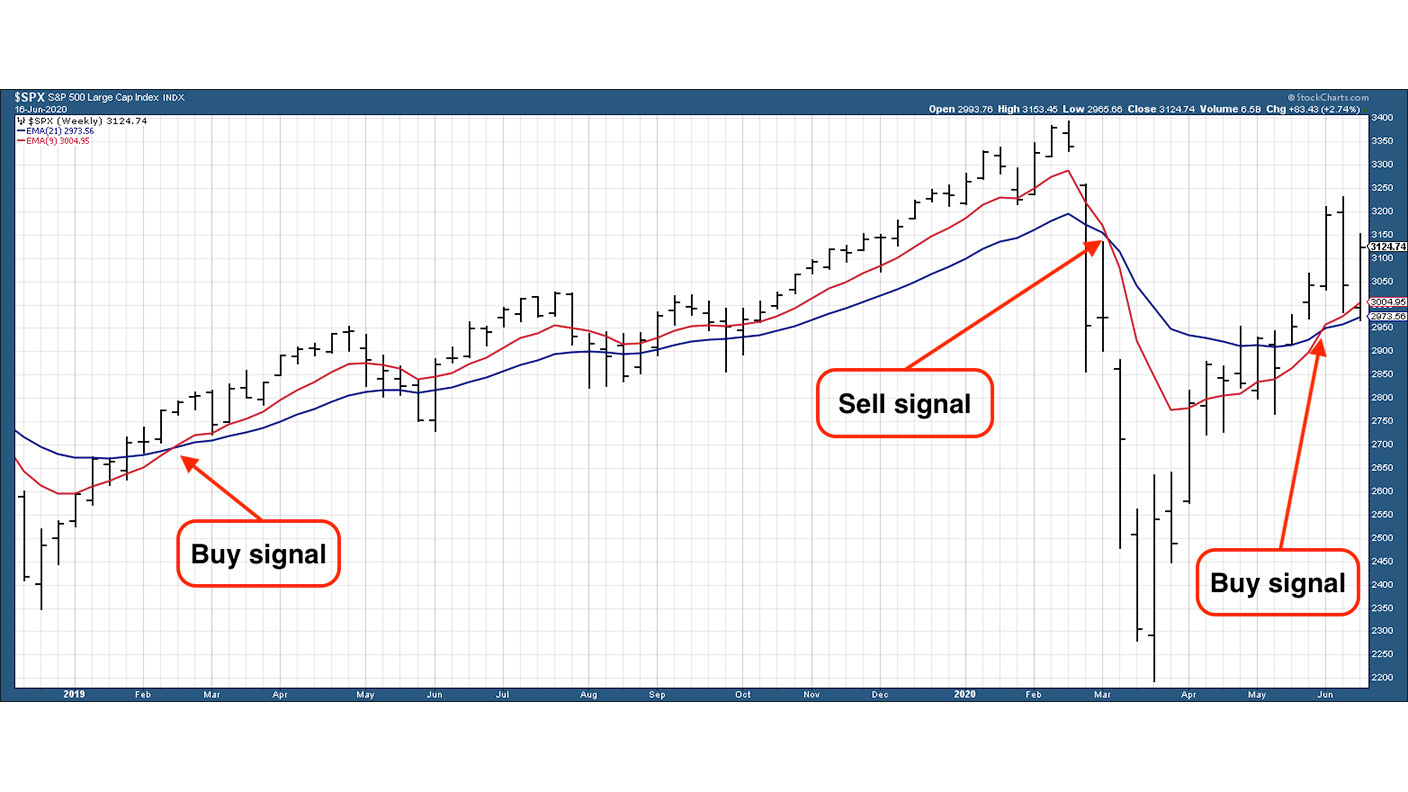
Here’s a weekly chart of the S&P 500 over the past 18 months. You can see the buy signal we got in February 2019 at 2,850, the one I was beating the drum over. The sell signal came in March of 2020 at 2,850. So you gave back a year of gains. Not good. However, you were also out of the market for the capitulation.

A fortnight or so ago we had the buy signal. This time at 3,050.
Now, you could say you may as well have just stayed long the whole time, and in this instance you would be right. But at least you were out of the market for the crash. And if this had morphed into a longer-term structural bear market, you would not have been exposed to that.
There are ways and means to embellish the system using stop losses, shorter-term moving averages, and systems to buy and sell if the price gets too far above or below its moving averages. A smarter, shorter-term trader might have bought the market in late March, for example. But, as I say, the object of this system is to catch long-term trends and strip out shorter-term volatility. And the system now has us on a buy signal.
Will this trend last – riding a flood of newly-printed money, as Donald Trump tries to buy an election victory in the autumn? (Trump’s popularity ratings rise and fall with the S&P). Or are the underlying social problems far too great for the trend in the S&P to survive? Who cares! Neither matters. The system says be long. The rest is noise.
Do you dare follow it? Or do you trust some other form of judgement?
Daylight Robbery – How Tax Shaped The Past And Will Change The Future is available at Amazon and all good bookstores with the audiobook, read by Dominic, on Audible and elsewhere. If you want a signed copy, you can order one here.
Get the latest financial news, insights and expert analysis from our award-winning MoneyWeek team, to help you understand what really matters when it comes to your finances.

-
 Can mining stocks deliver golden gains?
With gold and silver prices having outperformed the stock markets last year, mining stocks can be an effective, if volatile, means of gaining exposure
-
 8 ways the ‘sandwich generation’ can protect wealth
People squeezed between caring for ageing parents and adult children or younger grandchildren – known as the ‘sandwich generation’ – are at risk of neglecting their own financial planning. Here’s how to protect yourself and your loved ones’ wealth.
-
 What's behind the big shift in Japanese government bonds?
Rising long-term Japanese government bond yields point to growing nervousness about the future – and not just inflation
-
 Halifax: House price slump continues as prices slide for the sixth consecutive month
UK house prices fell again in September as buyers returned, but the slowdown was not as fast as anticipated, latest Halifax data shows. Where are house prices falling the most?
-
 Rents hit a record high - but is the opportunity for buy-to-let investors still strong?
UK rent prices have hit a record high with the average hitting over £1,200 a month says Rightmove. Are there still opportunities in buy-to-let?
-
 Pension savers turn to gold investments
Investors are racing to buy gold to protect their pensions from a stock market correction and high inflation, experts say
-
 Where to find the best returns from student accommodation
Student accommodation can be a lucrative investment if you know where to look.
-
 The world’s best bargain stocks
Searching for bargain stocks with Alec Cutler of the Orbis Global Balanced Fund, who tells Andrew Van Sickle which sectors are being overlooked.
-
 Revealed: the cheapest cities to own a home in Britain
New research reveals the cheapest cities to own a home, taking account of mortgage payments, utility bills and council tax
-
 UK recession: How to protect your portfolio
As the UK recession is confirmed, we look at ways to protect your wealth.