The charts that matter: a week of two halves
After a week in which the markets shot up, then crashed back, John Stepek looks at how the charts that matter most to the global economy look now.

Get the latest financial news, insights and expert analysis from our award-winning MoneyWeek team, to help you understand what really matters when it comes to your finances.
You are now subscribed
Your newsletter sign-up was successful
Want to add more newsletters?

Twice daily
MoneyWeek
Get the latest financial news, insights and expert analysis from our award-winning MoneyWeek team, to help you understand what really matters when it comes to your finances.

Four times a week
Look After My Bills
Sign up to our free money-saving newsletter, filled with the latest news and expert advice to help you find the best tips and deals for managing your bills. Start saving today!
Welcome back.
I’ve been talking about the risk of inflation taking off for ages now. Want to know how it’s going to happen? We discuss it – and ways to prepare your portfolio – in a lot more detail in the current issue of MoneyWeek.
Sign up now to get your first six issues free plus an e-book about previous booms and busts. Subscribe here now.
MoneyWeek
Subscribe to MoneyWeek today and get your first six magazine issues absolutely FREE

Sign up to Money Morning
Don't miss the latest investment and personal finances news, market analysis, plus money-saving tips with our free twice-daily newsletter
Don't miss the latest investment and personal finances news, market analysis, plus money-saving tips with our free twice-daily newsletter
Here are the links for this week’s editions of Money Morning.
- Monday:What Friday's stonking US jobs report means for markets
- Tuesday:Investing in the UK: the good, the bad and the ugly
- Merryn’s blog: We could be at a pivotal point in the growth/value cycle
- Wednesday: Ten reasons inflation could be set to return
- Thursday: The Fed will print whatever it takes – what does that mean for markets?
- Friday: Why did the stockmarket fall? Maybe it’s because it rose too far, too fast
And don’t miss the podcast this week – Merryn interviewed former hedge fund manager Hugh Hendry, who is not a man who worries about speaking his mind. You can check out why he thinks the Federal Reserve needs to convince us all that it has entirely lost the plot – and how it could go about it. Hugh also compares gold to Disneyland.
And if that puts you in the mood for some contrarian thinking, why not grab a copy of my book, The Sceptical Investor? You can get the audio book here, or the print/ebook version here.
Onto today’s charts of the week.
The charts that matter
It was a bit of a week of two halves – the bit before the Federal Reserve announcement on Wednesday, and the bit afterwards. The tech-heavy Nasdaq index hit a new record high above 10,000 briefly, then slid back along with other markets on Thursday. Overall it felt as though markets had come too far, too fast on a wave of “V-shaped” exuberance – but we’ll see what next week holds.
Gold had a better week than last, recovering solidly after it had slid following Friday’s much-better-than-feared US employment numbers.
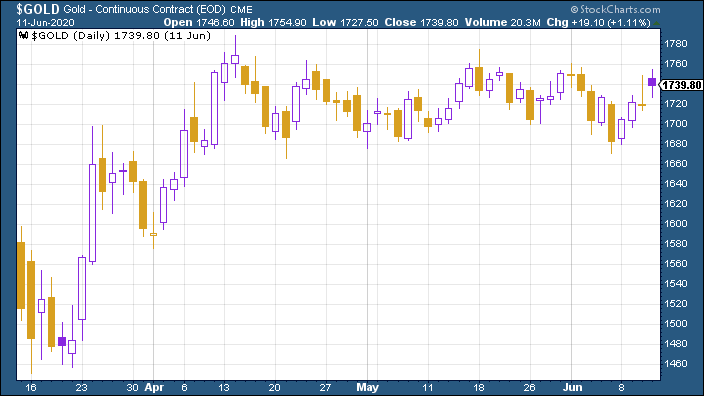
(Gold: three months)
The US dollar index (DXY – a measure of the strength of the dollar against a basket of the currencies of its major trading partners) stalled in its journey lower this week, as investors had a spasm of panic on Thursday. Again though it’s worth noting that the dollar has been sliding without much of a break for about three weeks now – nothing moves in a straight line.
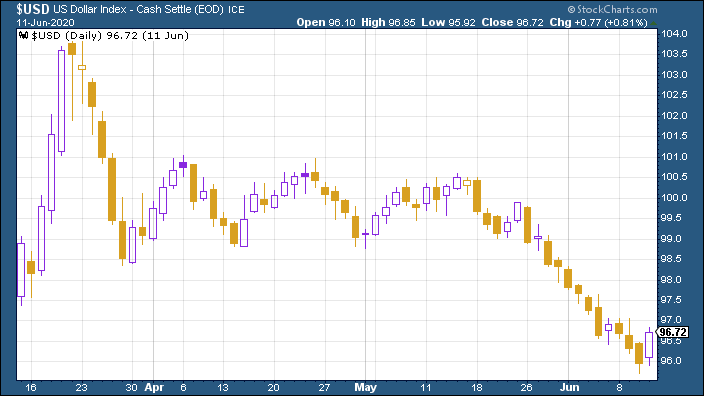
(DXY: three months)
Have you noticed something? China appears to have disappeared from the scene temporarily as a pending big problem. I’m sure it will make its way back into the headlines soon enough but for now, the Chinese yuan (or renminbi) has continued to strengthen gently against the US dollar, which is enough to keep markets from worrying about it.
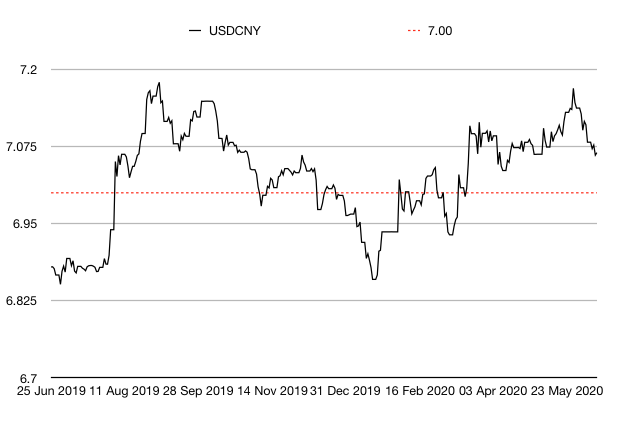
(Chinese yuan to the US dollar: since 25 Jun 2019)
The yield on the ten-year US government bond moved sharply lower again this week as Thursday’s jitters had investors heading back to “safe” havens.
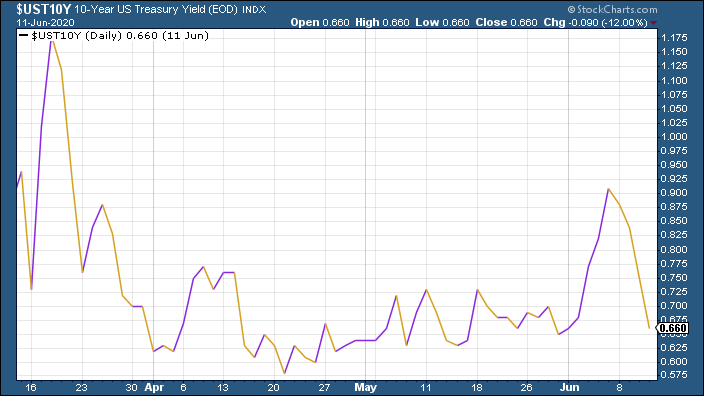
(Ten-year US Treasury yield: three months)
The yield on the Japanese ten-year slipped back to 0%.
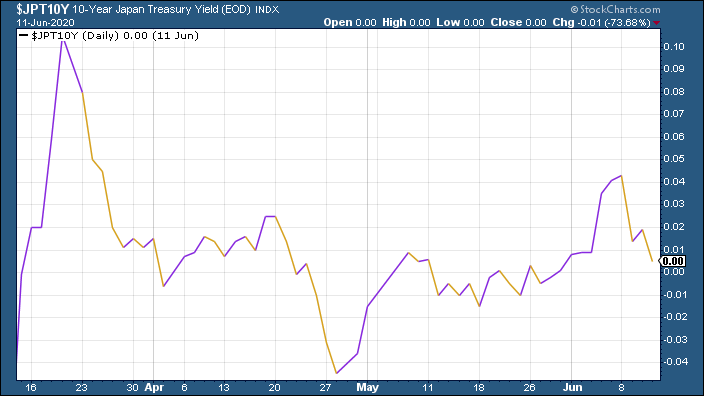
(Ten-year Japanese government bond yield: three months)
And the yield on the ten-year German Bund actually ended the week little changed although it was sharply lower after a mid-week bounce.
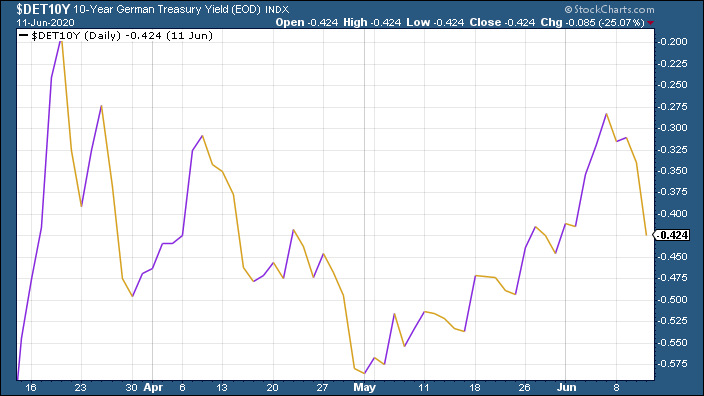
(Ten-year Bund yield: three months)
Copper actually ended the week higher, despite taking a hit on Thursday, after accelerating rapidly mid-week.
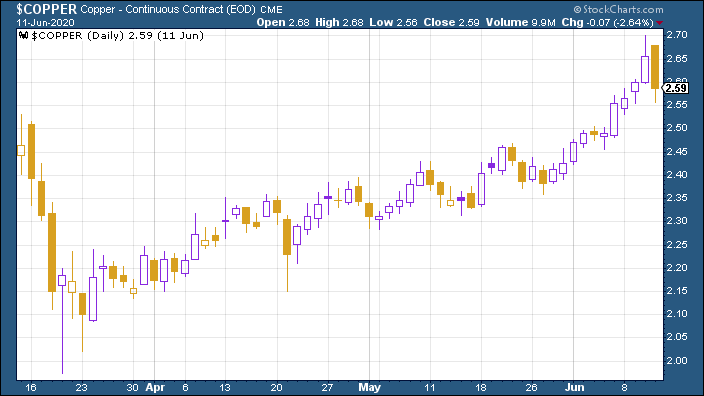
(Copper: three months)
The Aussie dollar which is more of a “risk-on” currency, had a push higher against the US dollar but stalled towards the end of the week and slid.
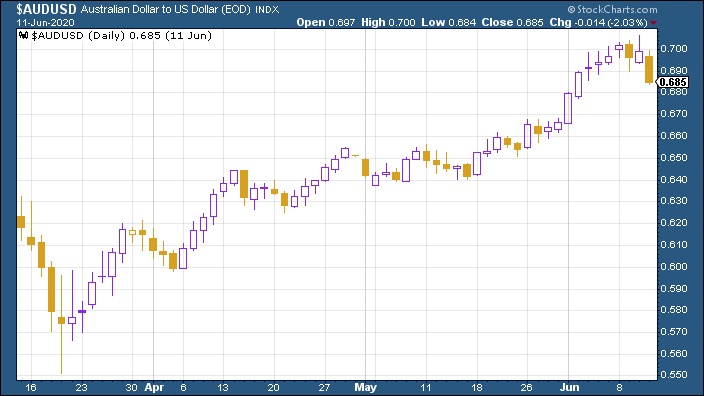
(Aussie dollar vs US dollar exchange rate: three months)
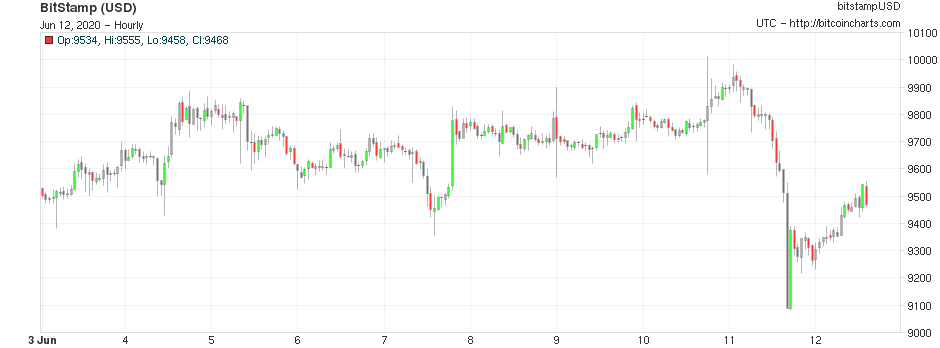
Cryptocurrency bitcoin remains surprisingly becalmed – it fell 10% on Thursday (which is interesting as it doesn’t always.
(Bitcoin: ten days)
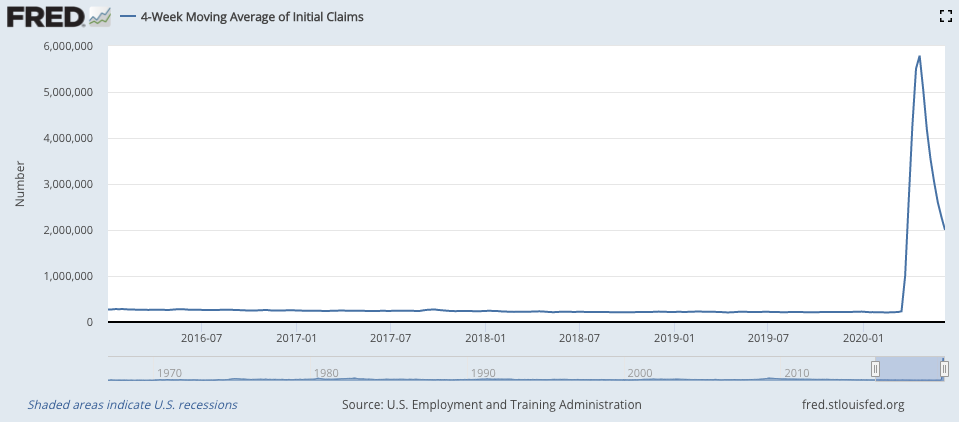
This week’s US weekly jobless claims figure continued to improve from an awful base. The number of new claims fell to 1.54 million (down from 1.9 million last week). The four-week moving average now sits at 2.0 million, compared to last week’s 2.28 million.
(US jobless claims, four-week moving average: since January 2016)
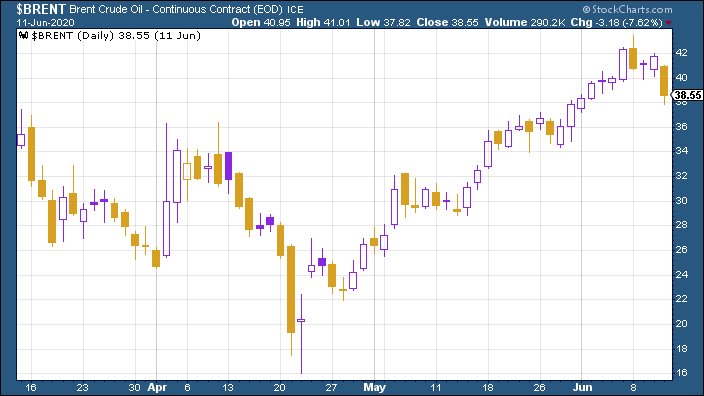
The oil price kept moving higher, then ran out of steam. Oil cartel Opec didn’t spring any real surprises at the weekend – production cuts will be maintained but there weren’t signs of big plans to extend them by much so markets were underwhelmed.
(Brent crude oil: three months)
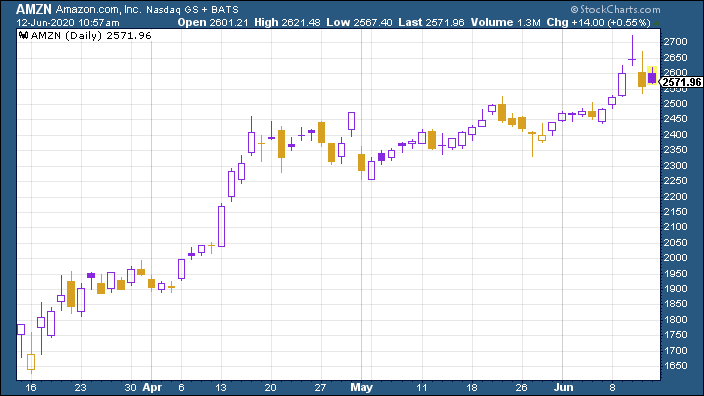
Amazon shares surged this week along with the wider market (despite the hiccup on Thursday).
(Amazon: three months)
It was the same story for electric car group Tesla which at one point hit yet another new record above $1,000 a share. That is incredible, really. In the last three months, Tesla’s share price has virtually trebled.
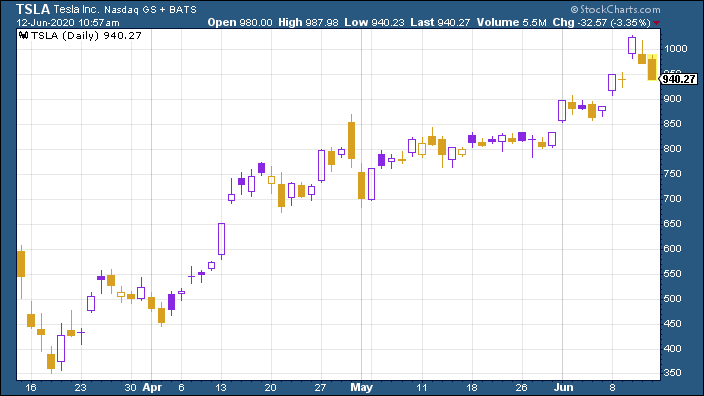
(Tesla: three months)
Get the latest financial news, insights and expert analysis from our award-winning MoneyWeek team, to help you understand what really matters when it comes to your finances.

-
 Average UK house price reaches £300,000 for first time, Halifax says
While the average house price has topped £300k, regional disparities still remain, Halifax finds.
-
 Barings Emerging Europe trust bounces back from Russia woes
Barings Emerging Europe trust has added the Middle East and Africa to its mandate, delivering a strong recovery, says Max King
-
 What's behind the big shift in Japanese government bonds?
Rising long-term Japanese government bond yields point to growing nervousness about the future – and not just inflation
-
 UK wages grow at a record pace
The latest UK wages data will add pressure on the BoE to push interest rates even higher.
-
 Trapped in a time of zombie government
It’s not just companies that are eking out an existence, says Max King. The state is in the twilight zone too.
-
 America is in deep denial over debt
The downgrade in America’s credit rating was much criticised by the US government, says Alex Rankine. But was it a long time coming?
-
 UK economy avoids stagnation with surprise growth
Gross domestic product increased by 0.2% in the second quarter and by 0.5% in June
-
 Bank of England raises interest rates to 5.25%
The Bank has hiked rates from 5% to 5.25%, marking the 14th increase in a row. We explain what it means for savers and homeowners - and whether more rate rises are on the horizon
-
 UK inflation remains at 8.7% ‒ what it means for your money
Inflation was unmoved at 8.7% in the 12 months to May. What does this ‘sticky’ rate of inflation mean for your money?
-
 Would a food price cap actually work?
Analysis The government is discussing plans to cap the prices of essentials. But could this intervention do more harm than good?