The charts that matter: universal basic bailouts and financial repression
John Stepek looks at how the action taken by central banks to prop up economies has affected the charts that matter most to the global economy

Get the latest financial news, insights and expert analysis from our award-winning MoneyWeek team, to help you understand what really matters when it comes to your finances.
You are now subscribed
Your newsletter sign-up was successful
Want to add more newsletters?

Twice daily
MoneyWeek
Get the latest financial news, insights and expert analysis from our award-winning MoneyWeek team, to help you understand what really matters when it comes to your finances.

Four times a week
Look After My Bills
Sign up to our free money-saving newsletter, filled with the latest news and expert advice to help you find the best tips and deals for managing your bills. Start saving today!
Before we get started today: if you’re not already a subscriber to MoneyWeek magazine then firstly, I’d ask why not?
The financial world is moving incredibly fast right now. Coronavirus and more importantly, our reaction to it will have long-lasting impacts on both the global economy and on your own pension, Isas, savings and prospects.
So if there’s ever been a more important time in the last 50 years to understand what’s going on, I can’t think of it.
MoneyWeek
Subscribe to MoneyWeek today and get your first six magazine issues absolutely FREE

Sign up to Money Morning
Don't miss the latest investment and personal finances news, market analysis, plus money-saving tips with our free twice-daily newsletter
Don't miss the latest investment and personal finances news, market analysis, plus money-saving tips with our free twice-daily newsletter
Having said all that, I’d then point out that we currently have another very good reason for you to subscribe now. Not only will we give you your first six issues absolutely free, but you also get a free ebook – MoneyWeek’s Little Book of Big Crashes. In it, I discuss some of the biggest market crashes in world history, what caused them and what we might be able to learn from them – including lessons for today’s coronavirus crisis.
Don’t put it off any longer – sign up for your subscription right now.
(PS, if you’re an existing subscriber, you should already have been sent your special download link for the book – email us at editor@moneyweek.com with your subscriber number or address details if you haven’t received it).
So, getting back to this week’s business – we have a couple of real podcast treats for you this week, all about how we get out of the coronavirus crisis and what the world beyond it looks like.
Early in the week, Merryn spoke to the FT’s Gillian Tett about the outlook – Gillian gives a particularly clear and concise explanation of financial repression and why it’s highly likely to come next.
And then on Thursday, she had a chat with Australian economist Professor Steve Keen all about his idea that a debt jubilee is the only viable way to press the “reset” button on the global economy.
Even if you don’t normally listen to podcasts I strongly urge you to make time for both of these.
And here are the links for this week’s editions of Money Morning plus other stories you might have missed on the website this week.
- Good Friday: Hyperinflation – could it happen here?
- Saturday: What can the 1957 stockmarket crash teach us about the coronavirus crisis?
- Easter Monday: We’re on the road to a global debt jubilee – that’s if we’re lucky
- Merryn’s blog: Why the world after coronavirus could be a lot fairer
- Tuesday:Broaden your investment horizons with global trusts
- Merryn’s blog: The trials of Temple Bar: an update on the MoneyWeek investment trust portfolio
- Wednesday: The uranium price is finally on the rise – here’s the easiest way to bet on a bull market
- Thursday: Here’s why the coronavirus crash is likely to end in inflation
- Friday: The French president is warning that the EU could break up over coronavirus – is he right?
- Buy The Sceptical Investor – your guide to contrarian investing
The charts that matter
Gold (measured in dollar terms) has had a decent fortnight. The spectacular action taken by central banks to prop up economies has raised the prospect of inflation once all of this is behind us. The US dollar is also off its panic highs, which helps.
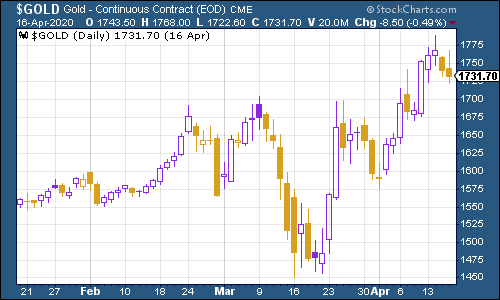
(Gold: three months)
The US dollar index – a measure of the strength of the dollar against a basket of the currencies of its major trading partners – is off its highs although still in demand. We’ll see what happens as poor economic data and a printer-happy Federal Reserve is offset against the vast global appetite for dollars.
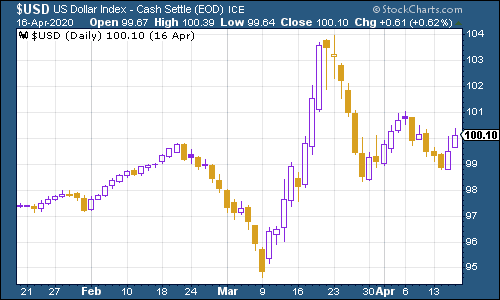
(DXY: three months)
The Chinese yuan (or renminbi) is still above the $1/¥7 mark that gets markets nervous, but the yuan is nowhere near its weakest point for the last year, so that’s one less thing for investors to worry about (for now).
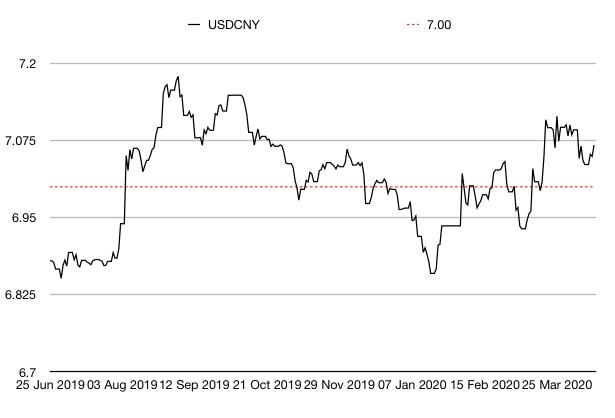
(Chinese yuan to the US dollar: since 25 Jun 2019)
The yield on the ten-year US government bond remains extremely low showing that while inflation might be viewed as a long-term outcome, it’s not something bond investors are worrying about right now. Although why worry when the Fed will buy it off you in any case?
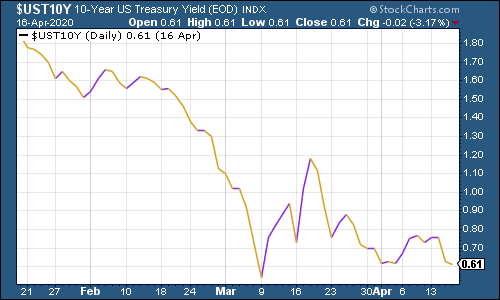
(Ten-year US Treasury yield: three months)
The yield on the Japanese ten-year was little changed, but it did squeak into positive territory.
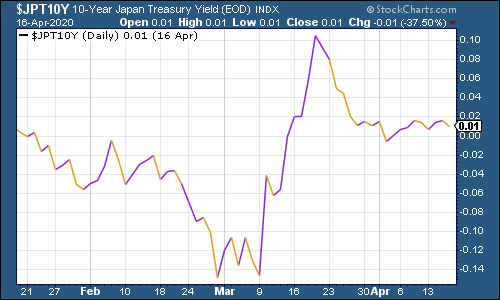
(Ten-year Japanese government bond yield: three months)
The yield on the ten-year German Bund meanwhile, was a little lower, though well above its panic lows from last month.
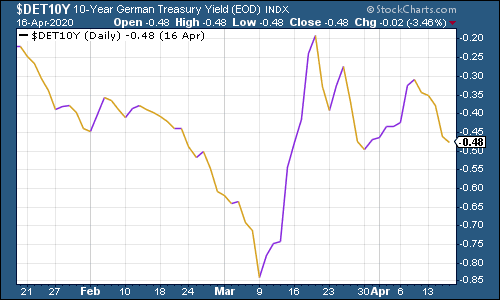
(Ten-year Bund yield: three months)
Copper has continued to hold above its 2016 lows and climb slowly higher. As I noted before, that doesn’t necessarily mean that we’ve seen the bottom for markets but with some countries starting to come out of lockdown, maybe we have seen the bottom for copper (although remember that it’s partly being supported by mine shutdowns as well).
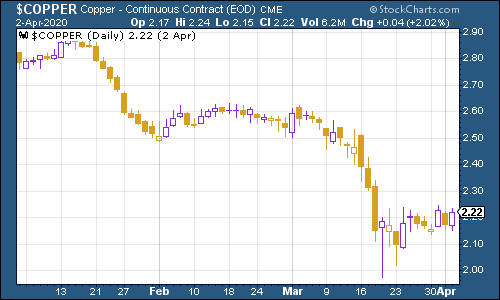
(Copper: five years and three months)
The Aussie dollar has improved significantly against the US dollar recently. That’s partly because Australia has had a pretty good corona crisis and also because China is bouncing back now.
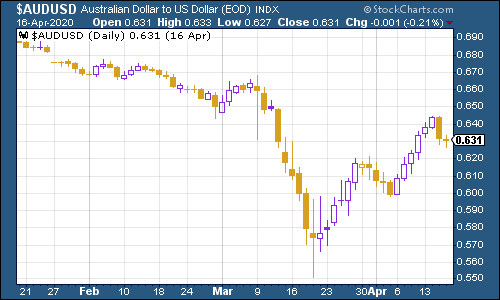
(Aussie dollar vs US dollar exchange rate: three months)
Cryptocurrency bitcoin has again had a really rather quiet few weeks, in stark contrast to most other assets.
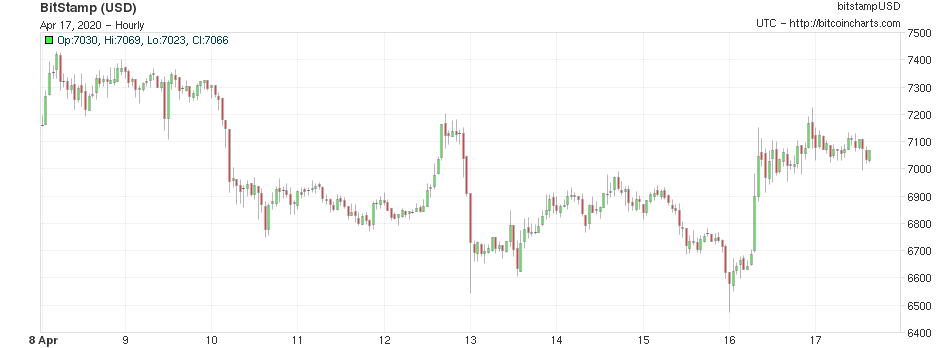
(Bitcoin: ten days)
US weekly jobless claims were once again very depressing, although markets have now grown used to it. This week saw jobless claims surge to 5.2m, from 6.6m last week. The four-week moving average now sits at 5.5m, yet another all-time record.
Obviously, that’s off the scale bad, and the US is now almost certainly in recession. The main questions now all relate to eventual recovery: will it be V-shaped (quick and sharp), U-shaped (slower), W-shaped (up and down) or L-shaped (there isn’t one)?
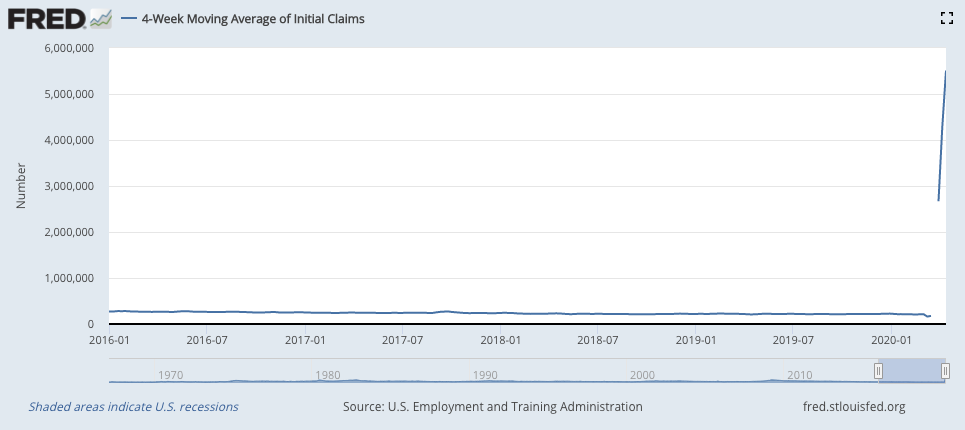
(US jobless claims, four-week moving average: since January 2016)
The oil price (as measured by Brent crude, the international/European benchmark) has started to give back some of its recent gains. Oil cartel Opec plus the Russians did agree to big production cuts along with US producers. But markets are sceptical about the reality of the cuts and also fear that the sheer scale of the demand drop is so great that perhaps it won’t be enough.
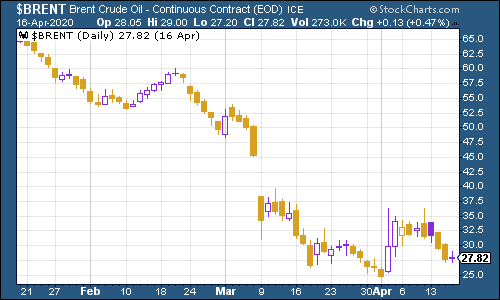
(Brent crude oil: three months)
Amazon shares have made new highs – it’s in demand because we’re all stuck at home, and it’s in demand because no one will fire you for owning it, and it’s in demand because we live in a world where the Fed will now print money to buy absolutely anything.
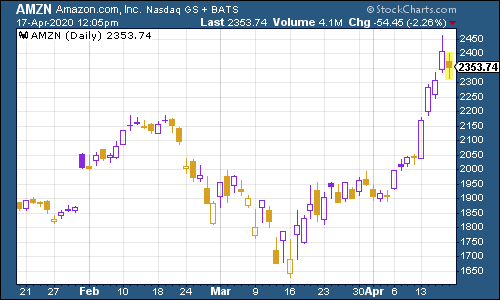
(Amazon: three months)
The latter reason explains partly why electric car group Tesla is getting close to record highs again too.
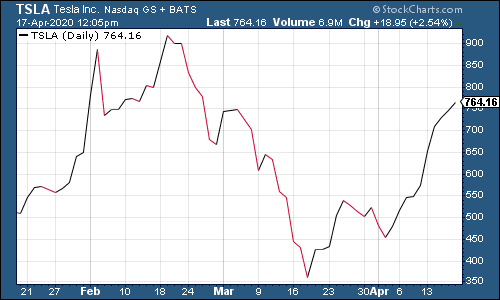
(Tesla: three months)
Have a good weekend.
Get the latest financial news, insights and expert analysis from our award-winning MoneyWeek team, to help you understand what really matters when it comes to your finances.

-
 Can mining stocks deliver golden gains?
With gold and silver prices having outperformed the stock markets last year, mining stocks can be an effective, if volatile, means of gaining exposure
-
 8 ways the ‘sandwich generation’ can protect wealth
People squeezed between caring for ageing parents and adult children or younger grandchildren – known as the ‘sandwich generation’ – are at risk of neglecting their own financial planning. Here’s how to protect yourself and your loved ones’ wealth.
-
 UK wages grow at a record pace
The latest UK wages data will add pressure on the BoE to push interest rates even higher.
-
 Trapped in a time of zombie government
It’s not just companies that are eking out an existence, says Max King. The state is in the twilight zone too.
-
 America is in deep denial over debt
The downgrade in America’s credit rating was much criticised by the US government, says Alex Rankine. But was it a long time coming?
-
 UK economy avoids stagnation with surprise growth
Gross domestic product increased by 0.2% in the second quarter and by 0.5% in June
-
 Bank of England raises interest rates to 5.25%
The Bank has hiked rates from 5% to 5.25%, marking the 14th increase in a row. We explain what it means for savers and homeowners - and whether more rate rises are on the horizon
-
 UK inflation remains at 8.7% ‒ what it means for your money
Inflation was unmoved at 8.7% in the 12 months to May. What does this ‘sticky’ rate of inflation mean for your money?
-
 Would a food price cap actually work?
Analysis The government is discussing plans to cap the prices of essentials. But could this intervention do more harm than good?
-
 Is my pay keeping up with inflation?
Analysis High inflation means take home pay is being eroded in real terms. An online calculator reveals the pay rise you need to match the rising cost of living - and how much worse off you are without it.