The charts that matter: short-selling, silver and the return of bitcoin
As the online mob gets organised to move markets, John Stepek looks at how the charts that matter most to the global economy have fared this week.

Get the latest financial news, insights and expert analysis from our award-winning MoneyWeek team, to help you understand what really matters when it comes to your finances.
You are now subscribed
Your newsletter sign-up was successful
Want to add more newsletters?

Twice daily
MoneyWeek
Get the latest financial news, insights and expert analysis from our award-winning MoneyWeek team, to help you understand what really matters when it comes to your finances.

Four times a week
Look After My Bills
Sign up to our free money-saving newsletter, filled with the latest news and expert advice to help you find the best tips and deals for managing your bills. Start saving today!
Welcome back.
We had a massive response to Merryn’s interview on Thursday with Charles Plowden of Baillie Gifford, with a record number of readers tuning in to watch the webinar live. One regular subscriber emailed to tell us it was “incredibly insightful and useful… enjoyable, accessible and rewarding”. Plowden also shared some of the stocks he’s most interested in right now. If you missed it, the good news is that you can watch it on demand – tune in here.
In the magazine this week, we have a rare treat for you – Dominic Frisby writes about bitcoin and shares his take on the future of the cryptocurrency. He also explains how to go about buying it. If you’re not already a subscriber, pile in now and get your first six mags free.
MoneyWeek
Subscribe to MoneyWeek today and get your first six magazine issues absolutely FREE

Sign up to Money Morning
Don't miss the latest investment and personal finances news, market analysis, plus money-saving tips with our free twice-daily newsletter
Don't miss the latest investment and personal finances news, market analysis, plus money-saving tips with our free twice-daily newsletter
Amid all the excitement about GameStop and the uprising of the small investor against the tyranny of the short-selling hedge funds (or rather, just a group of private investors having fun and making money at the same time), we explain what “short-selling” is in our latest “Too Embarrassed To Ask” video. Have a watch here, and let me know what you think at editor@moneyweek.com.
And loosely connected to the GameStop shenanigans –there was a lot of excitement in silver later in the week, when it appeared that the same gang of investors who drove GameStop higher had started targeting the precious metal. Earlier this week, Merryn talked to Jupiter’s Ned Naylor-Leyland on the podcast about this specific topic – silver and the fundamental arguments for it. They also talk about gold, bitcoin, miners, debt jubilees, central banking, inflation – it’s a deep discussion of all of the most important money issues of the day and a lot of the topics that MoneyWeek readers tend to be most interested in – so don’t miss it!
Here are the links for this week’s editions of Money Morning and other web stories you may have missed.
- Monday: Think Tesla is a bubble? This might be the best way to bet on it bursting
- Merryn’s blog: Joe Biden’s spending spree will lift American spirits and markets – but it comes with a sting in the tail
- Tuesday: Forget rebalancing – ditch your losers, not your winners
- Wednesday: Bitcoin does consume a lot of energy – but here’s why it’s worth it
- Thursday: Why has GameStop’s share price jumped by 1,700% in a month?
- Friday: House prices in the UK's biggest cities might be set to follow rents lower
Now for the charts of the week.
The charts that matter
Gold had a remarkably boring week when you consider all the other stuff that went on (particularly in gold’s rather more volatile sibling, silver). It started to perk up towards the end of the week when silver attracted everyone’s attention, but otherwise, there wasn’t much movement to speak of. Being boring at times when everything else is exciting is something of a feature of gold though – it’s what you want it for.
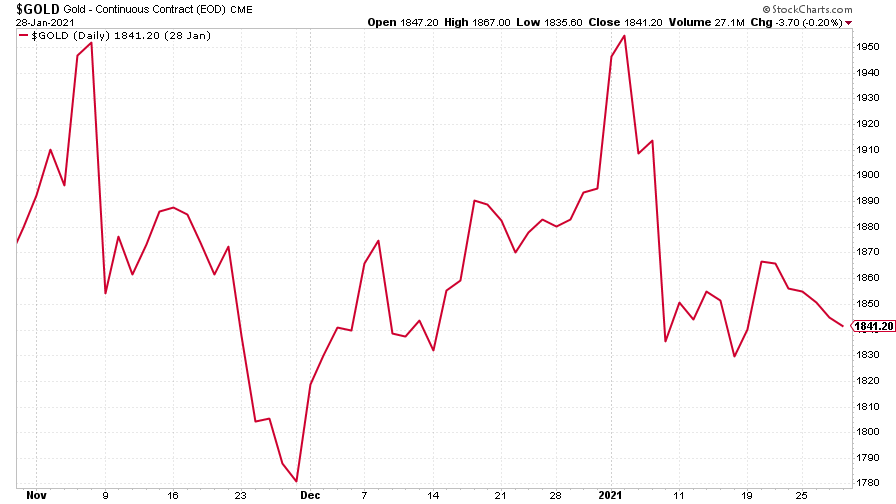
(Gold: three months)
The US dollar index (DXY – a measure of the strength of the dollar against a basket of the currencies of its major trading partners) ticked a little higher in the past week. As always, the dollar is one to keep a close eye on. The more this rises, the trickier it’ll be for the bull market to keep going. And this is one stretched bull market.
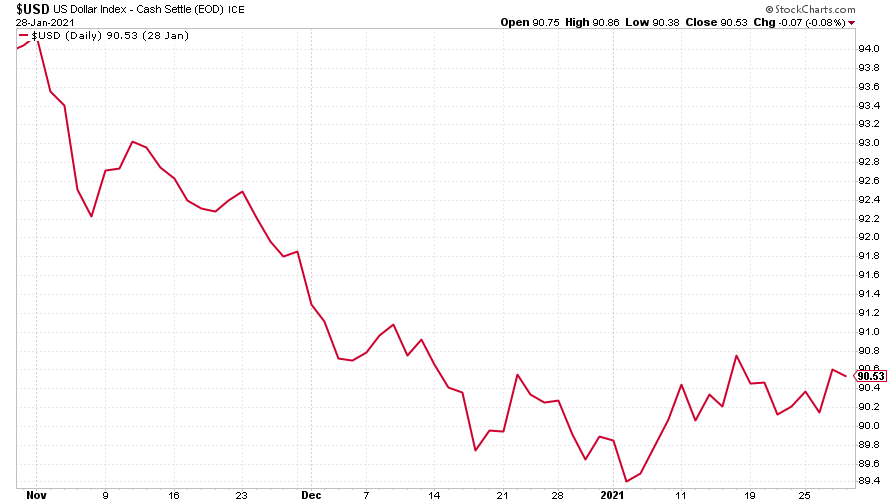
(DXY: three months)
That said, the Chinese yuan (or renminbi) continues to hold up against the US dollar (when the black line is falling, the yuan is strengthening).
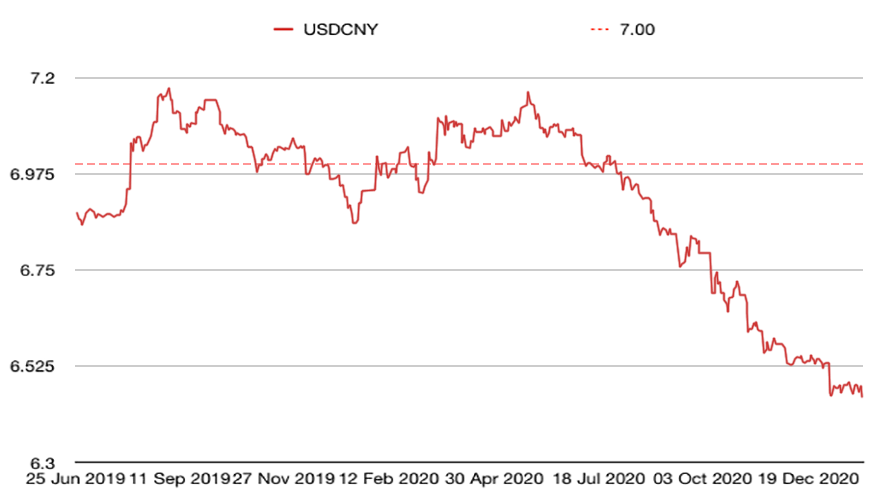
(Chinese yuan to the US dollar: since 25 Jun 2019)
The yield on the ten-year US government bond was little changed this week, although it remained above the 1% mark.
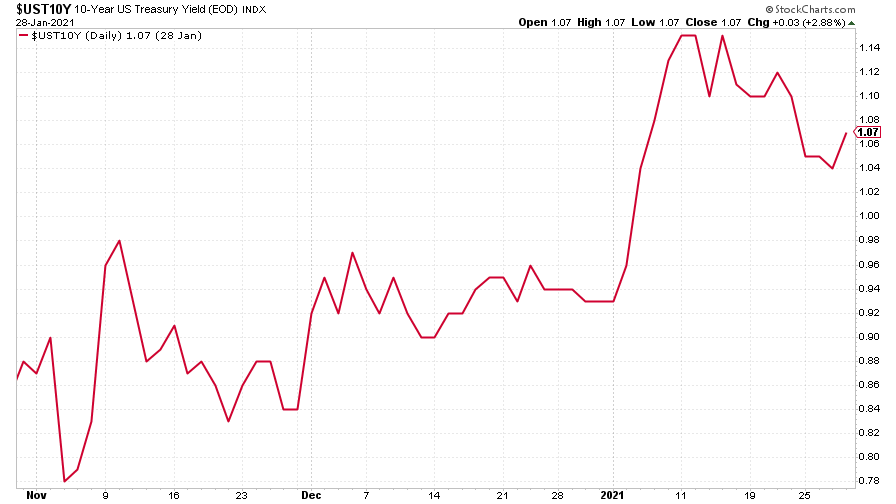
(Ten-year US Treasury yield: three months)
The yield on the Japanese ten-year remained near 0% as usual.
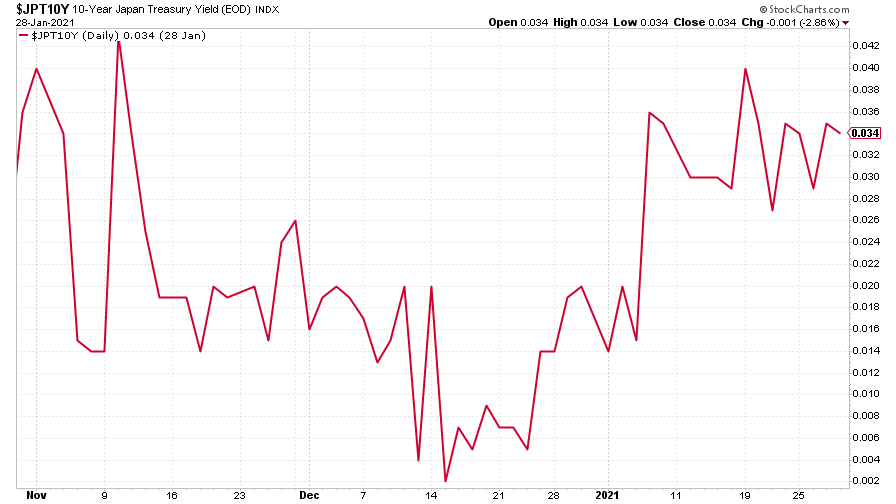
(Ten-year Japanese government bond yield: three months)
And the yield on the ten-year German Bund was a little lower.
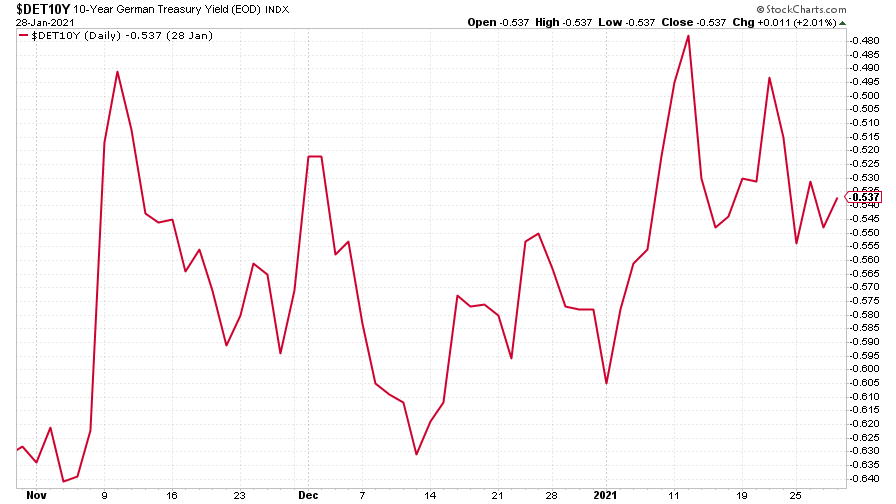
(Ten-year Bund yield: three months)
Copper has seen its relentless advance slow down a little in the past couple of weeks.
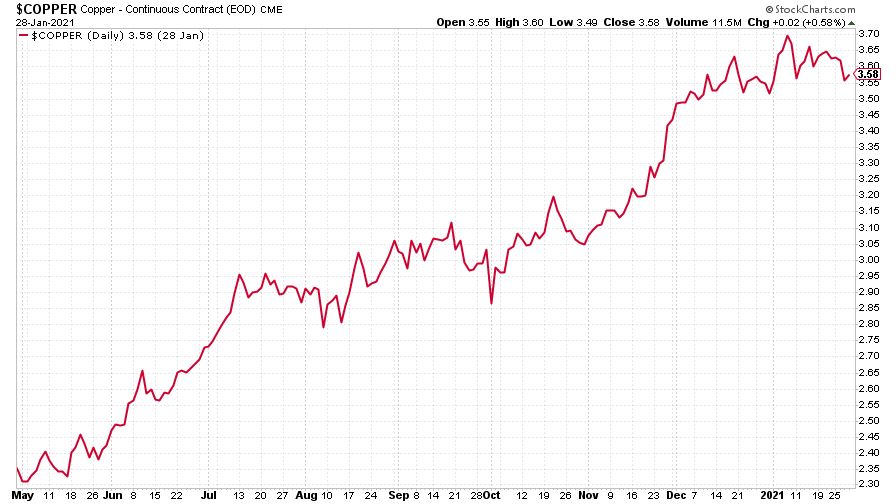
(Copper: nine months)
Meanwhile the commodities-and-China-dependent Aussie dollar has started to tick lower. These things are worth watching. A drop in demand from China is a risk to the global economy right now, particularly when we’re a long way from being out of the woods as far as the pandemic goes.
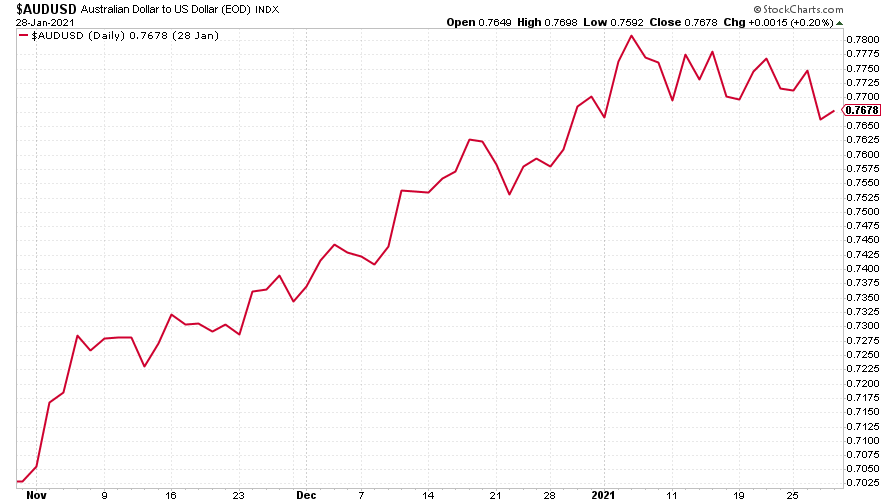
(Aussie dollar vs US dollar exchange rate: three months)
Cryptocurrency bitcoin rebounded sharply towards the end of the week after a steep fall. I’d like to think it’s because it’s on our cover this week (subscribe here), but I suspect it’s more because Elon Musk decided to stick bitcoin in his Twitter bio.
Yes, I know how that sounds – and yes, it’s a clear sign along with everything else that we’re well into the “deranged, you’ll tell your grandkids about this” phase of the bubble – but everyone is hoping that Musk will stick some of his cash into bitcoin. So there’s a sort-of logic to it. Anyway, Dominic actually discusses that in more detail in this week’s MoneyWeek magazine.
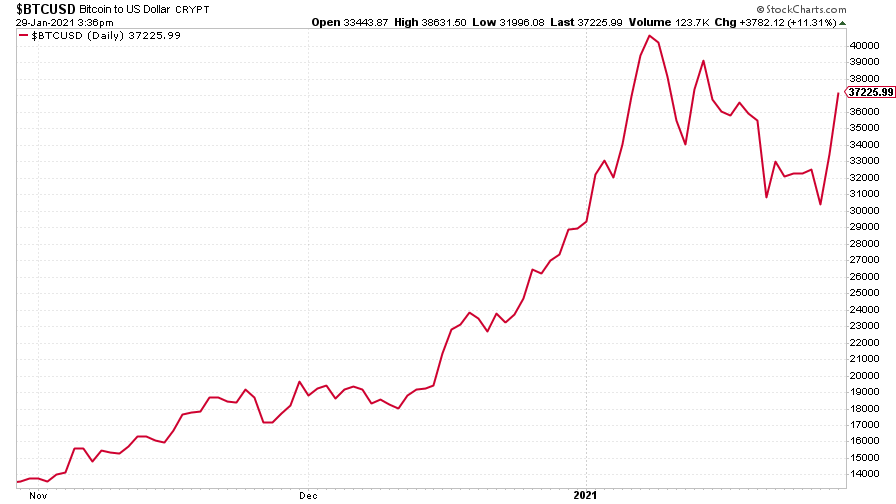
(Bitcoin: three months)
US weekly jobless claims fell to 847,000, compared to 914,000 last week (revised higher from 900,000). The four-week moving average rose to 868,000 from 851,750 (which was revised higher from 848,000) the week before.
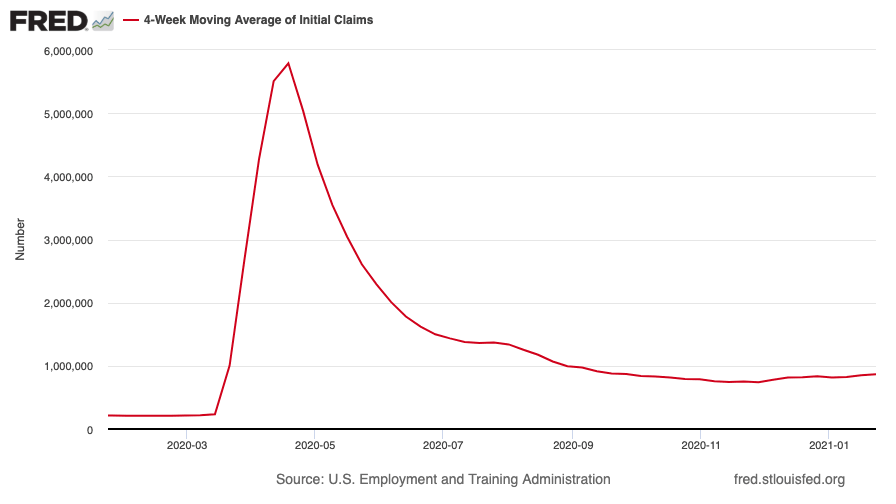
(US jobless claims, four-week moving average: since Jan 2020)
The oil price (as measured by Brent crude) remained above the $55 mark though again, like other commodities, it’s showing some signs of fatigue.
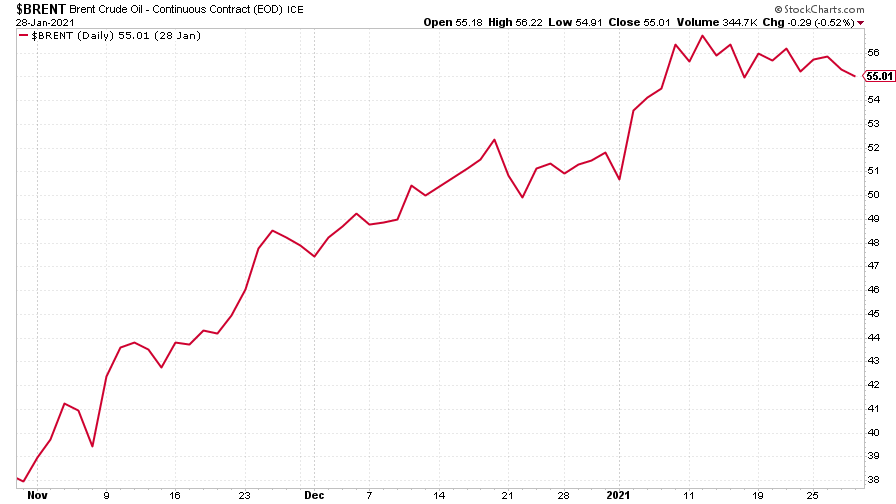
(Brent crude oil: three months)
Amazon is still trading in that tight range that it's been in since topping out in September. This week it was slipping back down the way.
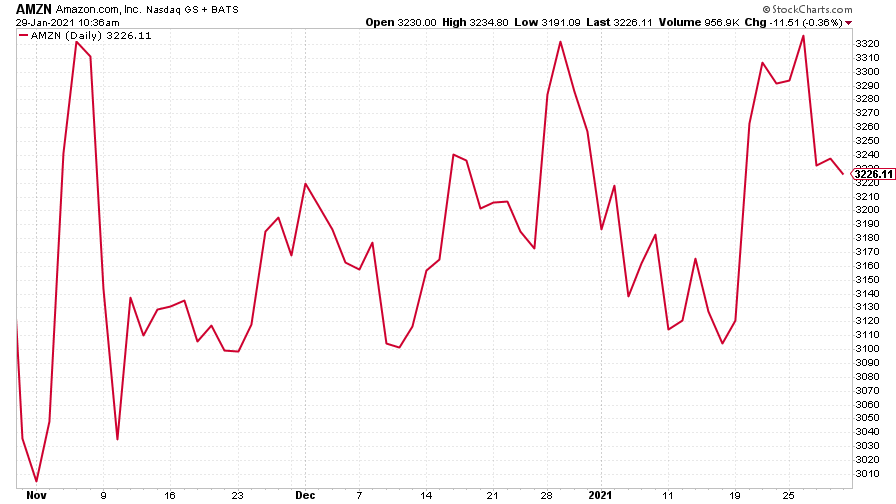
(Amazon: three months)
Meanwhile Tesla also continued to drift lower. I mean, who needs it when you have GameStop, eh?
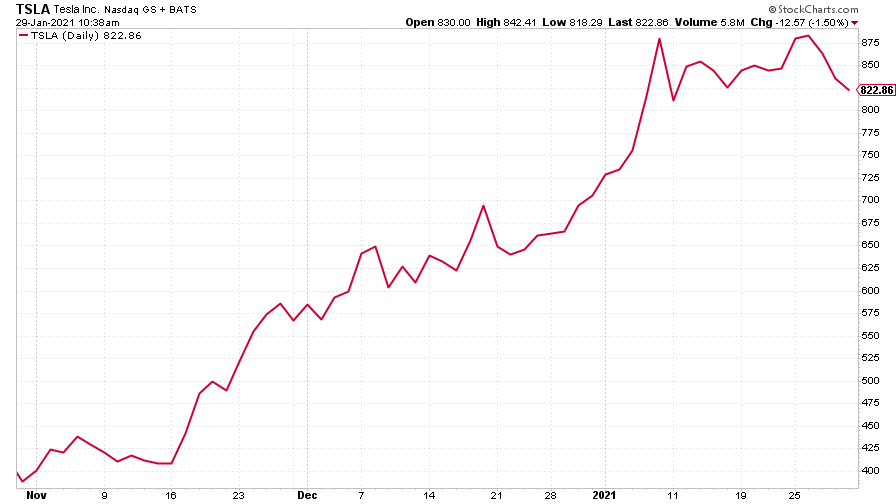
(Tesla: three months)
Have a great weekend. Remember to watch Merryn’s interview!
Get the latest financial news, insights and expert analysis from our award-winning MoneyWeek team, to help you understand what really matters when it comes to your finances.

-
 MoneyWeek Talks: The funds to choose in 2026
Podcast Fidelity's Tom Stevenson reveals his top three funds for 2026 for your ISA or self-invested personal pension
-
 Three companies with deep economic moats to buy now
Opinion An economic moat can underpin a company's future returns. Here, Imran Sattar, portfolio manager at Edinburgh Investment Trust, selects three stocks to buy now
-
 UK wages grow at a record pace
The latest UK wages data will add pressure on the BoE to push interest rates even higher.
-
 Trapped in a time of zombie government
It’s not just companies that are eking out an existence, says Max King. The state is in the twilight zone too.
-
 America is in deep denial over debt
The downgrade in America’s credit rating was much criticised by the US government, says Alex Rankine. But was it a long time coming?
-
 UK economy avoids stagnation with surprise growth
Gross domestic product increased by 0.2% in the second quarter and by 0.5% in June
-
 Bank of England raises interest rates to 5.25%
The Bank has hiked rates from 5% to 5.25%, marking the 14th increase in a row. We explain what it means for savers and homeowners - and whether more rate rises are on the horizon
-
 UK inflation remains at 8.7% ‒ what it means for your money
Inflation was unmoved at 8.7% in the 12 months to May. What does this ‘sticky’ rate of inflation mean for your money?
-
 Would a food price cap actually work?
Analysis The government is discussing plans to cap the prices of essentials. But could this intervention do more harm than good?
-
 Is my pay keeping up with inflation?
Analysis High inflation means take home pay is being eroded in real terms. An online calculator reveals the pay rise you need to match the rising cost of living - and how much worse off you are without it.