Get the latest financial news, insights and expert analysis from our award-winning MoneyWeek team, to help you understand what really matters when it comes to your finances.
You are now subscribed
Your newsletter sign-up was successful
Want to add more newsletters?

Twice daily
MoneyWeek
Get the latest financial news, insights and expert analysis from our award-winning MoneyWeek team, to help you understand what really matters when it comes to your finances.

Four times a week
Look After My Bills
Sign up to our free money-saving newsletter, filled with the latest news and expert advice to help you find the best tips and deals for managing your bills. Start saving today!
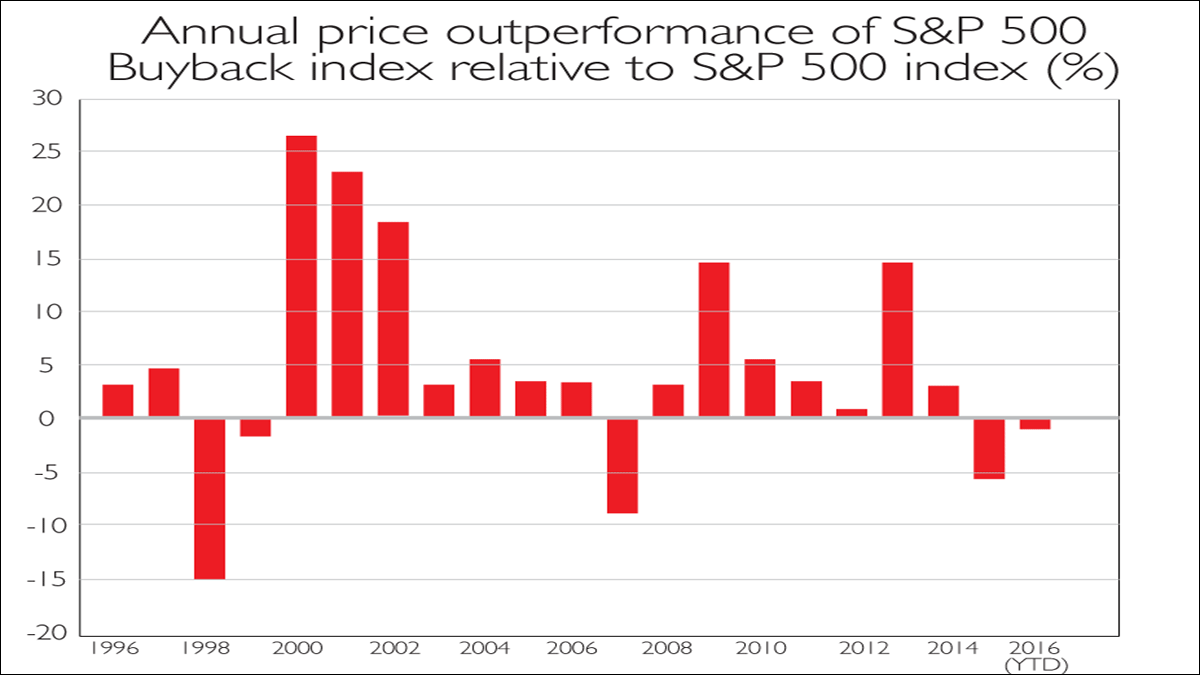
It's clear that share buybacks have given America's S&P 500 index a "big boost" over the past few years, says Capital Economics. The practice gives equity prices a fillip by increasing earnings per share and adding to the number of buyers in a market.
The S&P 500 Buyback index, which follows the 100 shares with the highest buyback ratios, soared by 240% between early 2009 and the start of 2015. Since then, however, it has underperformed the S&P a relatively rare occurrence, as the bar chart shows. The upshot is that an important tailwind for US equities is abating.
MoneyWeek
Subscribe to MoneyWeek today and get your first six magazine issues absolutely FREE

Sign up to Money Morning
Don't miss the latest investment and personal finances news, market analysis, plus money-saving tips with our free twice-daily newsletter
Don't miss the latest investment and personal finances news, market analysis, plus money-saving tips with our free twice-daily newsletter
Get the latest financial news, insights and expert analysis from our award-winning MoneyWeek team, to help you understand what really matters when it comes to your finances.
MoneyWeek is written by a team of experienced and award-winning journalists, plus expert columnists. As well as daily digital news and features, MoneyWeek also publishes a weekly magazine, covering investing and personal finance. From share tips, pensions, gold to practical investment tips - we provide a round-up to help you make money and keep it.
-
 Average UK house price reaches £300,000 for first time, Halifax says
While the average house price has topped £300k, regional disparities still remain, Halifax finds.
-
 Barings Emerging Europe trust bounces back from Russia woes
Barings Emerging Europe trust has added the Middle East and Africa to its mandate, delivering a strong recovery, says Max King
-
 What would the greatest mathematician of the Middle Ages say about gold today?
Sponsored Italian mathematician Fibonacci is most famous for a curious sequence of numbers. Continuing his series on technical analysis, Dominic Frisby explains what these numbers are, and what they can tell us about gold’s next move.
-
 How moving averages can reveal trades worth betting on – and ones to avoid
Sponsored Dominic Frisby looks in more depth at how moving averages can help you catch turning points in markets and help you decide which trades are worth pursuing.
-
 This chart pattern could be extraordinarily bullish for gold
Charts The mother of all patterns is developing in the gold charts, says Dominic Frisby. And if everything plays out well, gold could hit a price that investors could retire on.
-
 Believe it or not, this market is a “buy”
Charts With the world in the state it’s in and the market so volatile, buying stocks right now might go against all your instincts. But that’s just what you should be doing, says Dominic Frisby. Here, he explains why.
-
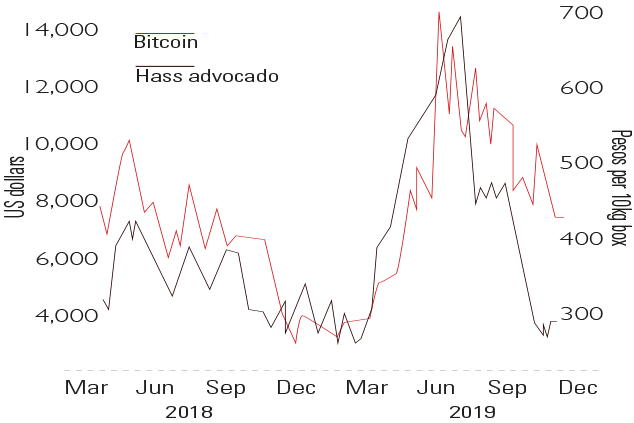 Chart of the week: avocados and bitcoin are in sync
Charts An amusing new spurious correlation has been spotted between the price of bitcoin and Mexican Hass avocados. In reality, of course, they have nothing to do with each other beyond “superficial price action”.
-
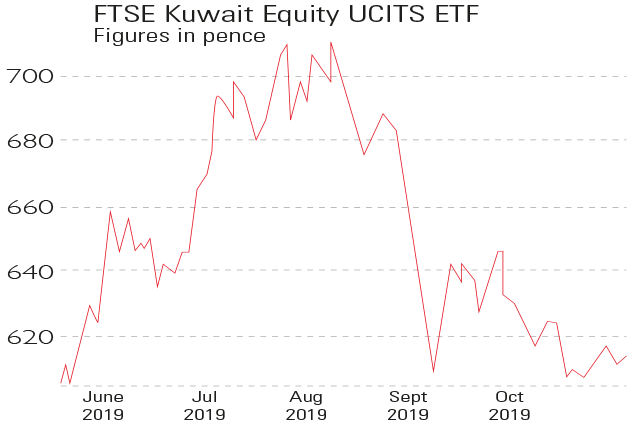 Chart of the week: Kuwait's stockmarket is ready for take-off
Charts Kuwait's stockmarket is due to be promoted from “frontier” status to an emerging market by index provider MSCI next June. That should entice almost $10bn of global investors’ cash into the country.
-
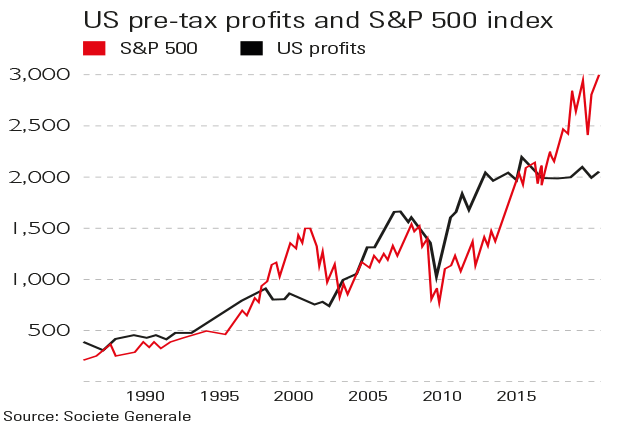 Chart of the week: US stocks outrun profits
Charts The US stockmarket has become totally detached from underlying profits of its constituent companies over the past three years.
-
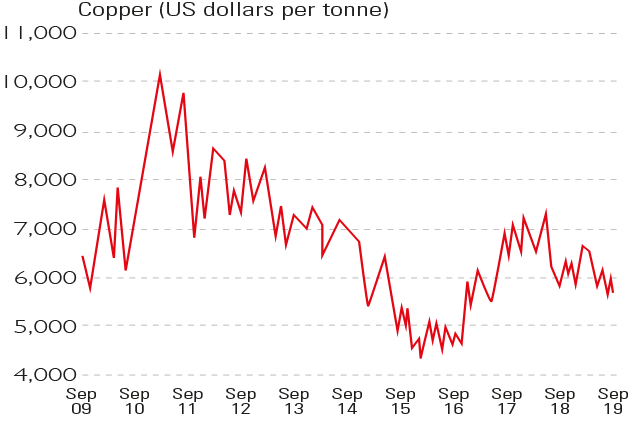 Chart of the week: Dr Copper diagnoses an ailing economy
Charts The price of copper has slipped by a fifth this year and is now at a near-two-year low of around $5,600 a tonne.

