Is it time to take profits on technology stocks?
With tech stocks continuing to slide, Dominic Frisby examines the charts and asks whether now is the time to sell.

Trend-following systems will never get you out at the very top, and they’ll never get you in at the very bottom. That’s not what they’re for.
Their purpose is to make sure that, when a market is trending, you are onboard. The result is hopefully that you catch 80–90% of a move.
So when the Nasdaq plunged to 6,600 back in March, no trend-following system would have signalled to you to buy at that low. (None that I know of, anyway.) But there are plenty that might have got you in around 8,000 say, or just below, and would have kept you onboard for this incredible recent run we have seen in tech.
MoneyWeek
Subscribe to MoneyWeek today and get your first six magazine issues absolutely FREE

Sign up to Money Morning
Don't miss the latest investment and personal finances news, market analysis, plus money-saving tips with our free twice-daily newsletter
Don't miss the latest investment and personal finances news, market analysis, plus money-saving tips with our free twice-daily newsletter
However, last week we flagged up numerous signs – using various different trend-following systems – that the trend might be ending.
Today, we re-visit those indicators and ask if the trend has now ended...
The short-term trend for the Nasdaq has definitely turned lower
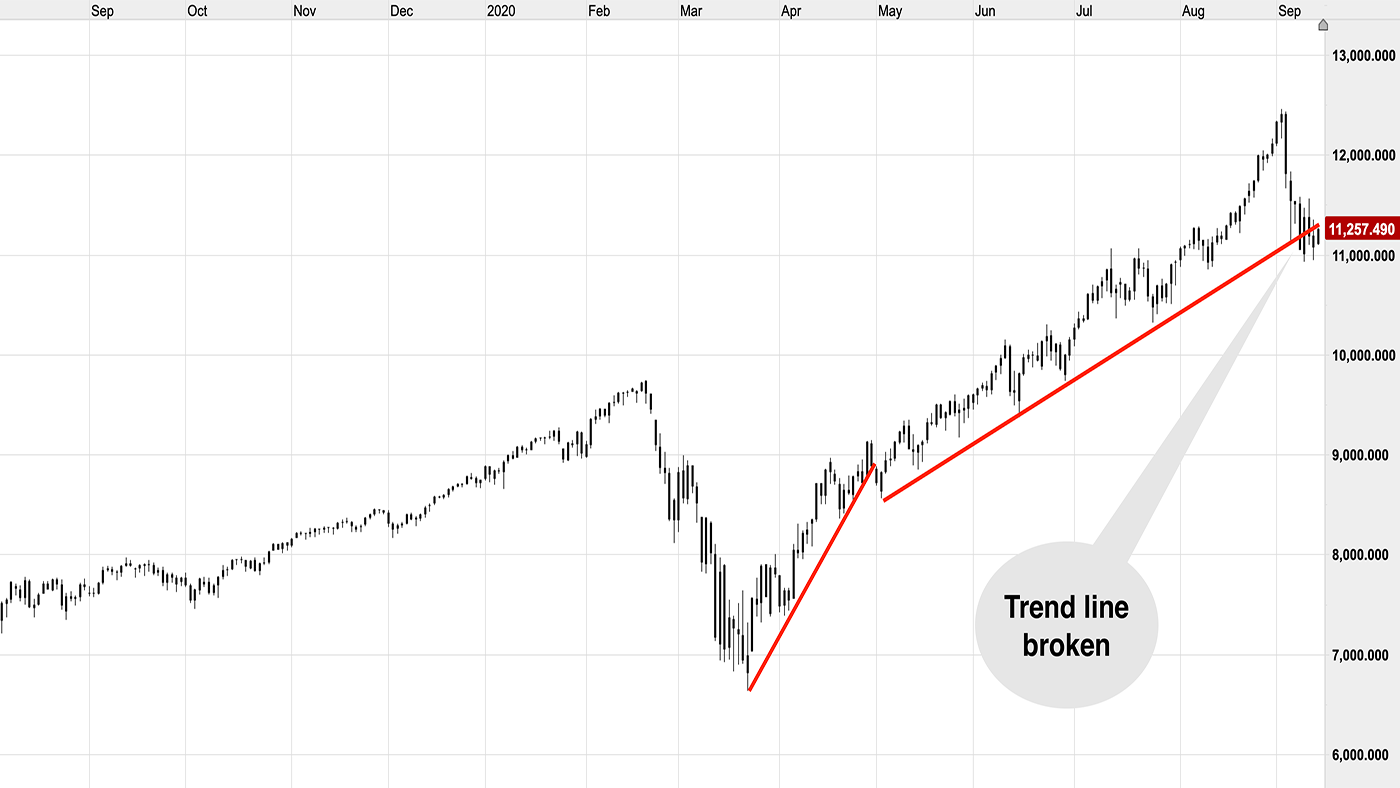
First up, we drew a simple trend line on the US Nasdaq index. As long as the price holds up above that trend line – drawn in red – the uptrend is intact. A violation of that trend line is a reason to sell.
Well, that trend line has now been breached. According to this system, it’s time to take some profits.

Often you might place a stop just below a trend line. Sure, you wouldn’t place it too close, you want to give yourself some wiggle room. But wiggle room or not, that stop would likely have now been hit.
In any case, that marvellous trend, by this measure at least, is now over.
Will a new trend start? Will it be up? Will it be down? Or are we now set for a frustrating period of range-trading? That is for the market gods to decide.
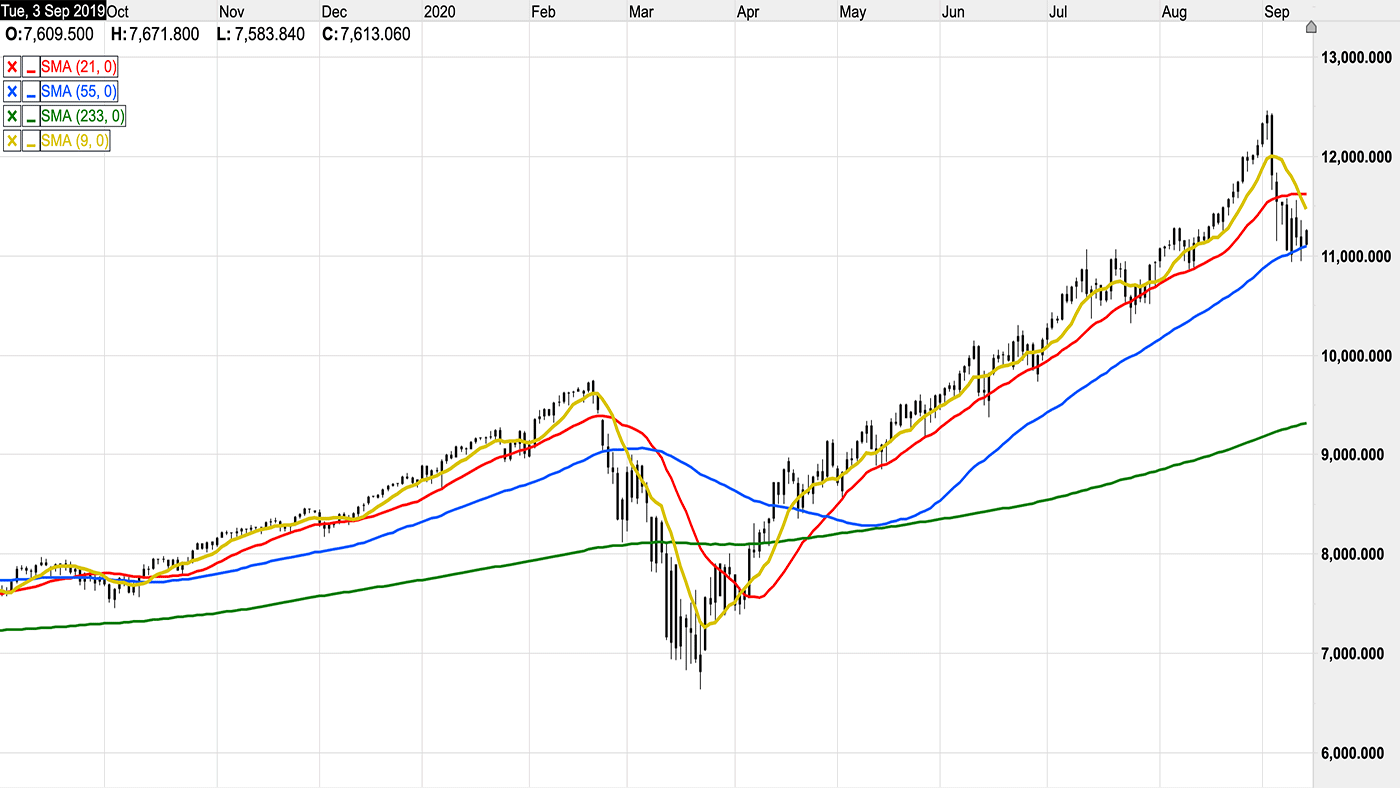
Next we plotted four moving averages to show us the trend over four different time frames – over nine days (yellow), 21 (red), 55 (blue) and 233 – effectively a year – in green.

You can see that the nine-day simple moving average is trending down – very much so. Over 21-days things have flattened out, but with the price below, unless the market suddenly turns up, we are about to enter a downtrend there too.
Short-term trend-followers would now be short.
Over the 55-day time frame (the blue line) however, we are still in an uptrend. It is sloping up and the price is above, just.
By the time you strip out weekends, the 55-day trend is roughly the three-month trend. It can often mark a good entry point. So there’s a decision to be made – do you buy here?
I would probably caution against it, with the shorter-term indicators so strongly negative.
My favourite indicator is saying that it’s time to take profits
So now we turn to my third and probably most reliable trend-following indicator – the moving average cross. For intermediate-term trends, a useful pair is the 21- and nine-day exponential moving average combination. (Exponential moving averages give extra weight to more recent days.)
Spoiler alert – the system works beautifully in trending markets. It is utterly useless in range-trading markets.
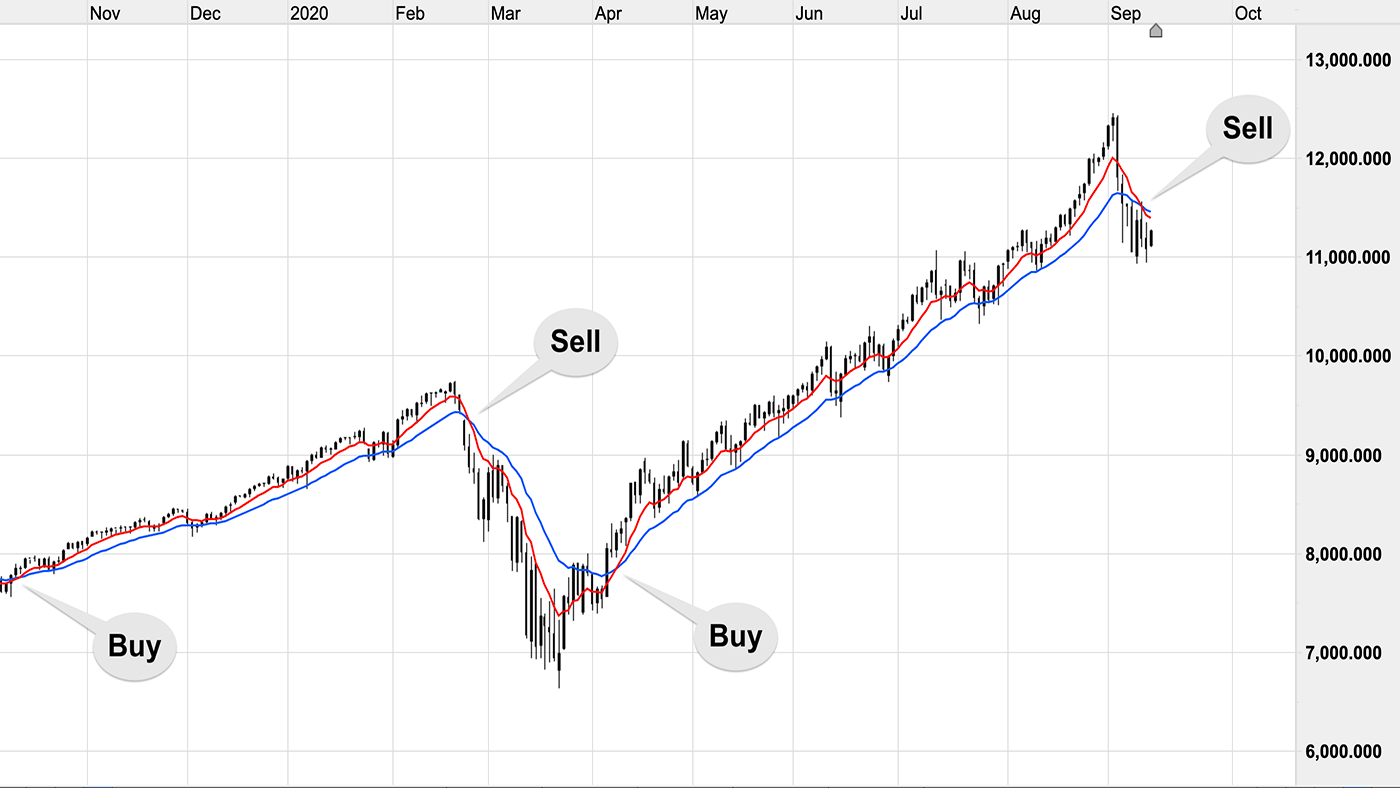
Below, on this daily chart, we see the nine-EMA in red, and the 21-EMA in blue. When the red line crosses up through the blue, and the price is above, there is your buy signal. When the reverse happens, and the red line crosses down through the blue and the price is below, that is your sell signal.
Here we see the Nasdaq over the past year. The system has worked a dream. Two buys and two sells. Of note, however, is that we just got the second of those two sells last week.

Shorting (trying to profit from prices going lower) is a dangerous game and should only be entertained if you really know what you’re doing. But selling doesn’t necessarily mean shorting. It can just mean taking profits.
In any case, with the trend line broken and the cross combination pointing lower, the indicators are saying that the uptrend in tech is now over.
For what it’s worth, I do see some support on that chart at 11,000. I’ve been uber-bullish about tech since Covid hit, because the lockdown has so accelerated tech’s adoption.
But with my moving average combination pointing lower, I’m not so bullish now.
Get the latest financial news, insights and expert analysis from our award-winning MoneyWeek team, to help you understand what really matters when it comes to your finances.

-
 Barings Emerging Europe trust bounces back from Russia woes
Barings Emerging Europe trust has added the Middle East and Africa to its mandate, delivering a strong recovery, says Max King
-
 How a dovish Federal Reserve could affect you
Trump’s pick for the US Federal Reserve is not so much of a yes-man as his rival, but interest rates will still come down quickly, says Cris Sholto Heaton
-
 What's behind the big shift in Japanese government bonds?
Rising long-term Japanese government bond yields point to growing nervousness about the future – and not just inflation
-
 Why you should keep an eye on the US dollar, the most important price in the world
Advice The US dollar is the most important asset in the world, dictating the prices of vital commodities. Where it goes next will determine the outlook for the global economy says Dominic Frisby.
-
 What is FX trading?
What is FX trading and can you make money from it? We explain how foreign exchange trading works and the risks
-
 The Burberry share price looks like a good bet
Tips The Burberry share price could be on the verge of a major upswing as the firm’s profits return to growth.
-
 Sterling accelerates its recovery after chancellor’s U-turn on taxes
News The pound has recovered after Kwasi Kwarteng U-turned on abolishing the top rate of income tax. Saloni Sardana explains what's going on..
-
 Why you should short this satellite broadband company
Tips With an ill-considered business plan, satellite broadband company AST SpaceMobile is doomed to failure, says Matthew Partridge. Here's how to short the stock.
-
 It’s time to sell this stock
Tips Digital Realty’s data-storage business model is moribund, consumed by the rise of cloud computing. Here's how you could short the shares, says Matthew Partridge.
-
 Will Liz Truss as PM mark a turning point for the pound?
Analysis The pound is at its lowest since 1985. But a new government often markets a turning point, says Dominic Frisby. Here, he looks at where sterling might go from here.
