
It’s Monday morning, which means it’s time for the next in our series on technical analysis.
Today we consider one of the most commonly-used tools of the lot, one of the most effective – and yet, perhaps one of the most under-utilised.
You could, as a trader, use trend lines alone, and make good money...
Try 6 free issues of MoneyWeek today
Get unparalleled financial insight, analysis and expert opinion you can profit from.

Sign up to Money Morning
Don't miss the latest investment and personal finances news, market analysis, plus money-saving tips with our free twice-daily newsletter
Don't miss the latest investment and personal finances news, market analysis, plus money-saving tips with our free twice-daily newsletter
A simple line is all you need to set out the parameters of a solid trade
Here is an example of an uptrend. It’s a chart of copper over the last three months with a trend line in black.
This would be an “ascending trend line” – because it is going up – and I’ve drawn the line up alongside easily identifiable support areas.
If you use stops, you can then place your stop just below that line. When the line is breached, the trend is over, and you are stopped out.

In the case of copper, that little run we just had looks like it is now over, as the trend line is breached. You would now be out of that market.
Similarly we now consider a downtrend. The chart below shows the euro against the Swiss franc over the last five years. You can see that the euro is in a clear downtrend.
I found two major tops, in 2018 and 2019 (these are marked with red arrows). I drew a line between them, and thus do I have a trend line. In this case, a “descending trend line”.
That black line is now a clear line of resistance – one which you can trade off.

Interestingly, the euro is butted right up against that trend line now – and against other currencies, especially the US dollar, the euro is now in something of a bull market.
But you could take the line that this downtrend is going to hold, and that the Swiss franc will remain stronger.
So, you could short the euro here, with a stop just north of the black line. But you would do well to consider some shorter timeframes before taking a position.
Another useful device is to add a parallel trend line to a trend. This helps you to identify a range. It gives you an even clearer idea how a price is behaving, and perhaps points at which to buy and sell.
I’ve added a parallel line here, in the chart below. At that black line, the euro is finding some support (blue lines). It might be a point to consider taking some profit, or to move stops in tight.

The most important thing to remember – and the most commonly-made mistake – is to avoid trying to force the line to fit the market.
Applying trend lines to different timeframes in the pound sterling
Trend lines help you to identify a trend, and its range. It’s simple. You get three types of trend – up, down and sideways.
If you are considering a market, it is often a good idea to look at it over multiple timeframes. On a monthly chart, going back over ten or 20 years, something might be in a long-term uptrend.
But on a short-term daily, or even hourly chart, the story might be very different. Take sterling.
Here’s the pound versus the dollar since the early part of the century. You can see by the red descending trend line that the pound has been in a bear market since 2007, when it was at over $2.11. Remember that!

This is a long-term secular bear market.
However, within that downtrend, there have been bull markets (I’ve marked some of them in blue on the chart below) that have gone on for over a year. Those bull markets – and bears – have occurred within broader sideways ranges (dashed green lines).

So, we are using the trend lines to establish the parameters of a market.
Now, instead of looking at a 20-year chart, we zoom in to look at a chart of the last six months. And we see that sterling is rising against the dollar on one timeframe (red line).
But within that broader up trend, there have been up-cycles and down-cycles (blue lines) that have gone on for a couple of weeks or so at a time.
The latest ascending trend line has just been breached, and over the past few days we have been in a narrow range around the $1.30 mark (dashed green lines).

Where does sterling go next? Probably up – but you would manage your risk by saying that if it falls below the red line, I’m wrong and I’m out.
And that red descending trend line from the long-term chart above does look ominous.
So when you use trend lines always think about the timeframe you are using them on.
You only need two tops or bottoms to draw a trend line, the third will confirm it. The steeper a trend line – and the more short term – the less reliable it is going to be and the less likely it will hold.
Don’t try and force your trend lines to fit the market. If they do not fit, then the trend line is not valid.
Yes, it is rather arbitrary, more art than science. But the point is not to predict the future: it’s to help you to manage your risk by establishing parameters, in-points, and out-points, and to give you a clearer idea (and perhaps a different perspective) on broader trends.
From that point of view, trend lines are an extremely useful tool.

-
 How will inheritance tax apply to pensions from 2027?
Thousands more estates will be dragged into paying inheritance tax from April 2027 following changes around pension rules – here’s what you need to know to prepare.
-
 Andy Burnham becomes prime minister – what could be announced?
The ex-mayor of Greater Manchester took up top job in politics after Sir Keir Starmer’s resignation. What does a new prime minister mean for you?


-
 What's behind the big shift in Japanese government bonds?
Rising long-term Japanese government bond yields point to growing nervousness about the future – and not just inflation
-
 Why you should keep an eye on the US dollar, the most important price in the world
Advice The US dollar is the most important asset in the world, dictating the prices of vital commodities. Where it goes next will determine the outlook for the global economy says Dominic Frisby.
-
 What is FX trading?
What is FX trading and can you make money from it? We explain how foreign exchange trading works and the risks
-
 The Burberry share price looks like a good bet
Tips The Burberry share price could be on the verge of a major upswing as the firm’s profits return to growth.
-
 Sterling accelerates its recovery after chancellor’s U-turn on taxes
News The pound has recovered after Kwasi Kwarteng U-turned on abolishing the top rate of income tax. Saloni Sardana explains what's going on..
-
 Why you should short this satellite broadband company
Tips With an ill-considered business plan, satellite broadband company AST SpaceMobile is doomed to failure, says Matthew Partridge. Here's how to short the stock.
-
 It’s time to sell this stock
Tips Digital Realty’s data-storage business model is moribund, consumed by the rise of cloud computing. Here's how you could short the shares, says Matthew Partridge.
-
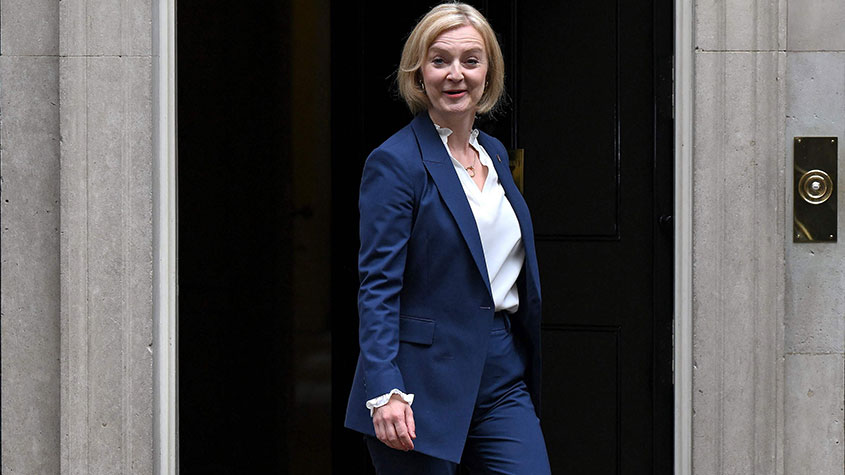 Will Liz Truss as PM mark a turning point for the pound?
Analysis The pound is at its lowest since 1985. But a new government often markets a turning point, says Dominic Frisby. Here, he looks at where sterling might go from here.


