
Since March, selling tech stocks short – that is to say, betting that they will fall – has been about as quick a way to the poor house as has ever been invented.
Tech stocks, in the form of the US Nasdaq index, have been in a runaway bull market. The index has, in less than six months, as near as dammit doubled, going from 6,600 to a September high of 12,450.
This is an astonishing performance for an index of this market cap. But is its epic run finally over?
Try 6 free issues of MoneyWeek today
Get unparalleled financial insight, analysis and expert opinion you can profit from.

Sign up to Money Morning
Don't miss the latest investment and personal finances news, market analysis, plus money-saving tips with our free twice-daily newsletter
Don't miss the latest investment and personal finances news, market analysis, plus money-saving tips with our free twice-daily newsletter
The trend higher in the Nasdaq is still intact – but only just
The might of big tech is quite astonishing. At more than $2trn, Apple now has a market cap bigger than the GDP of Brazil, Italy and Canada. With all of the coronavirus-related shrinking of GDP, it will probably have a bigger market cap than the UK when the 2020 figures come in next year.
Amazon, Alphabet (Google) and Facebook would all be top-15 countries. Only the US, China, Japan and Germany will be definitively larger.
You can shake your head and say that these valuations bear no relation to earnings and you’d be right. But it’s tech; they never do. Yet over the past few days we have seen something of a reversal. It is time to go short?
You do so at your peril, of course. But let’s try to detach from our biases, and consider this market from a purely technical point of view. In other words, by price action alone.
Last week we drew some trend lines on the Nasdaq, along with the advice “hold till the trend breaks, then sell”.200907-MM01
So we revisit that chart and we see that the trend – as measured by this red trend line below – just managed to stay intact. The Nasdaq sold off, hit the trend line, then bounced off it.

So there is one reason to stay long. If you’ve been long the Nasdaq, now might be a good time to take some profits
As you know, I like moving averages as a measure of trends. Depending on what moving average you use, you get the trend of different time frames.
The six-day simple moving average will show you the average price of the last six days – the six-day trend in other words, with all the price volatility smoothed out. When a price is moving up, the moving average will give you a smooth line up, and when a price is falling, the moving average will give you a smooth line down. If you are a trend-follower, the moving average will present to you that trend, and you simply follow it.
So here is a chart of the Nasdaq with several different simple moving averages (MAs). In yellow, we have the six-day; in red, the 21-day; in blue, the 55-day; and in green, the 233-day (effectively a one-year MA).

If you like to place several bets per week, you might use the six-day. If you like to trade once or twice per month, you might use the 21- or 55-day. Once or twice per year, then you would revert to the 233, or a similar time frame.
In a full-on bear market you will see the price below all of those MAs.
But big trends start with small trends. At present the six-day moving average has been broken and is now sloping down. The 21-day has also been broken and is flattening. These are both signs of a trend reversal.
The 55 and 233 are still intact and very much sloping up, so, on a longer term basis, the bull market is still very much intact.
Long-term value buys and sells are best placed around long-term moving averages such as the 233. In August 2019, for example, or in March of this year. But with the short-term change of direction, there is a valid reason to be taking profit off the table.
What happens this week could tell us whether it’s time to short the Nasdaq or not
I like to use moving average crosses as buy or sell signals. Quite a useful pair for trading intermediate-term trends is the 21- and nine-day exponential moving average combination. (Exponential moving averages give extra weight to more recent days.)
Below, on this daily chart, we see the nine-EMA in red, and the 21-EMA in blue. When the red line crosses up through the blue, and the price is above, there is your buy signal. When the reverse happens, and the red line crosses down through the blue and the price is below, that is your sell signal.
Be warned: the system works beautifully in trending markets. It is utterly useless in range-trading markets.
Here we see the Nasdaq over the past year. The system has worked a dream. Two buys and one sell. It made you a lot of money.

It is setting up for a sell now, but we are not quite there yet.
If the Nasdaq rallies this week, there’ll be no signal. But if it stays flat or it descends, then we get our sell signal. A sell signal by this measure combined with a violation of the trend line (in the first chart I showed) will be pretty definitive.

-
 How will inheritance tax apply to pensions from 2027?
Thousands more estates will be dragged into paying inheritance tax from April 2027 following changes around pension rules – here’s what you need to know to prepare.
-
 Andy Burnham becomes prime minister – what could be announced?
The ex-mayor of Greater Manchester took up top job in politics after Sir Keir Starmer’s resignation. What does a new prime minister mean for you?


-
 What's behind the big shift in Japanese government bonds?
Rising long-term Japanese government bond yields point to growing nervousness about the future – and not just inflation
-
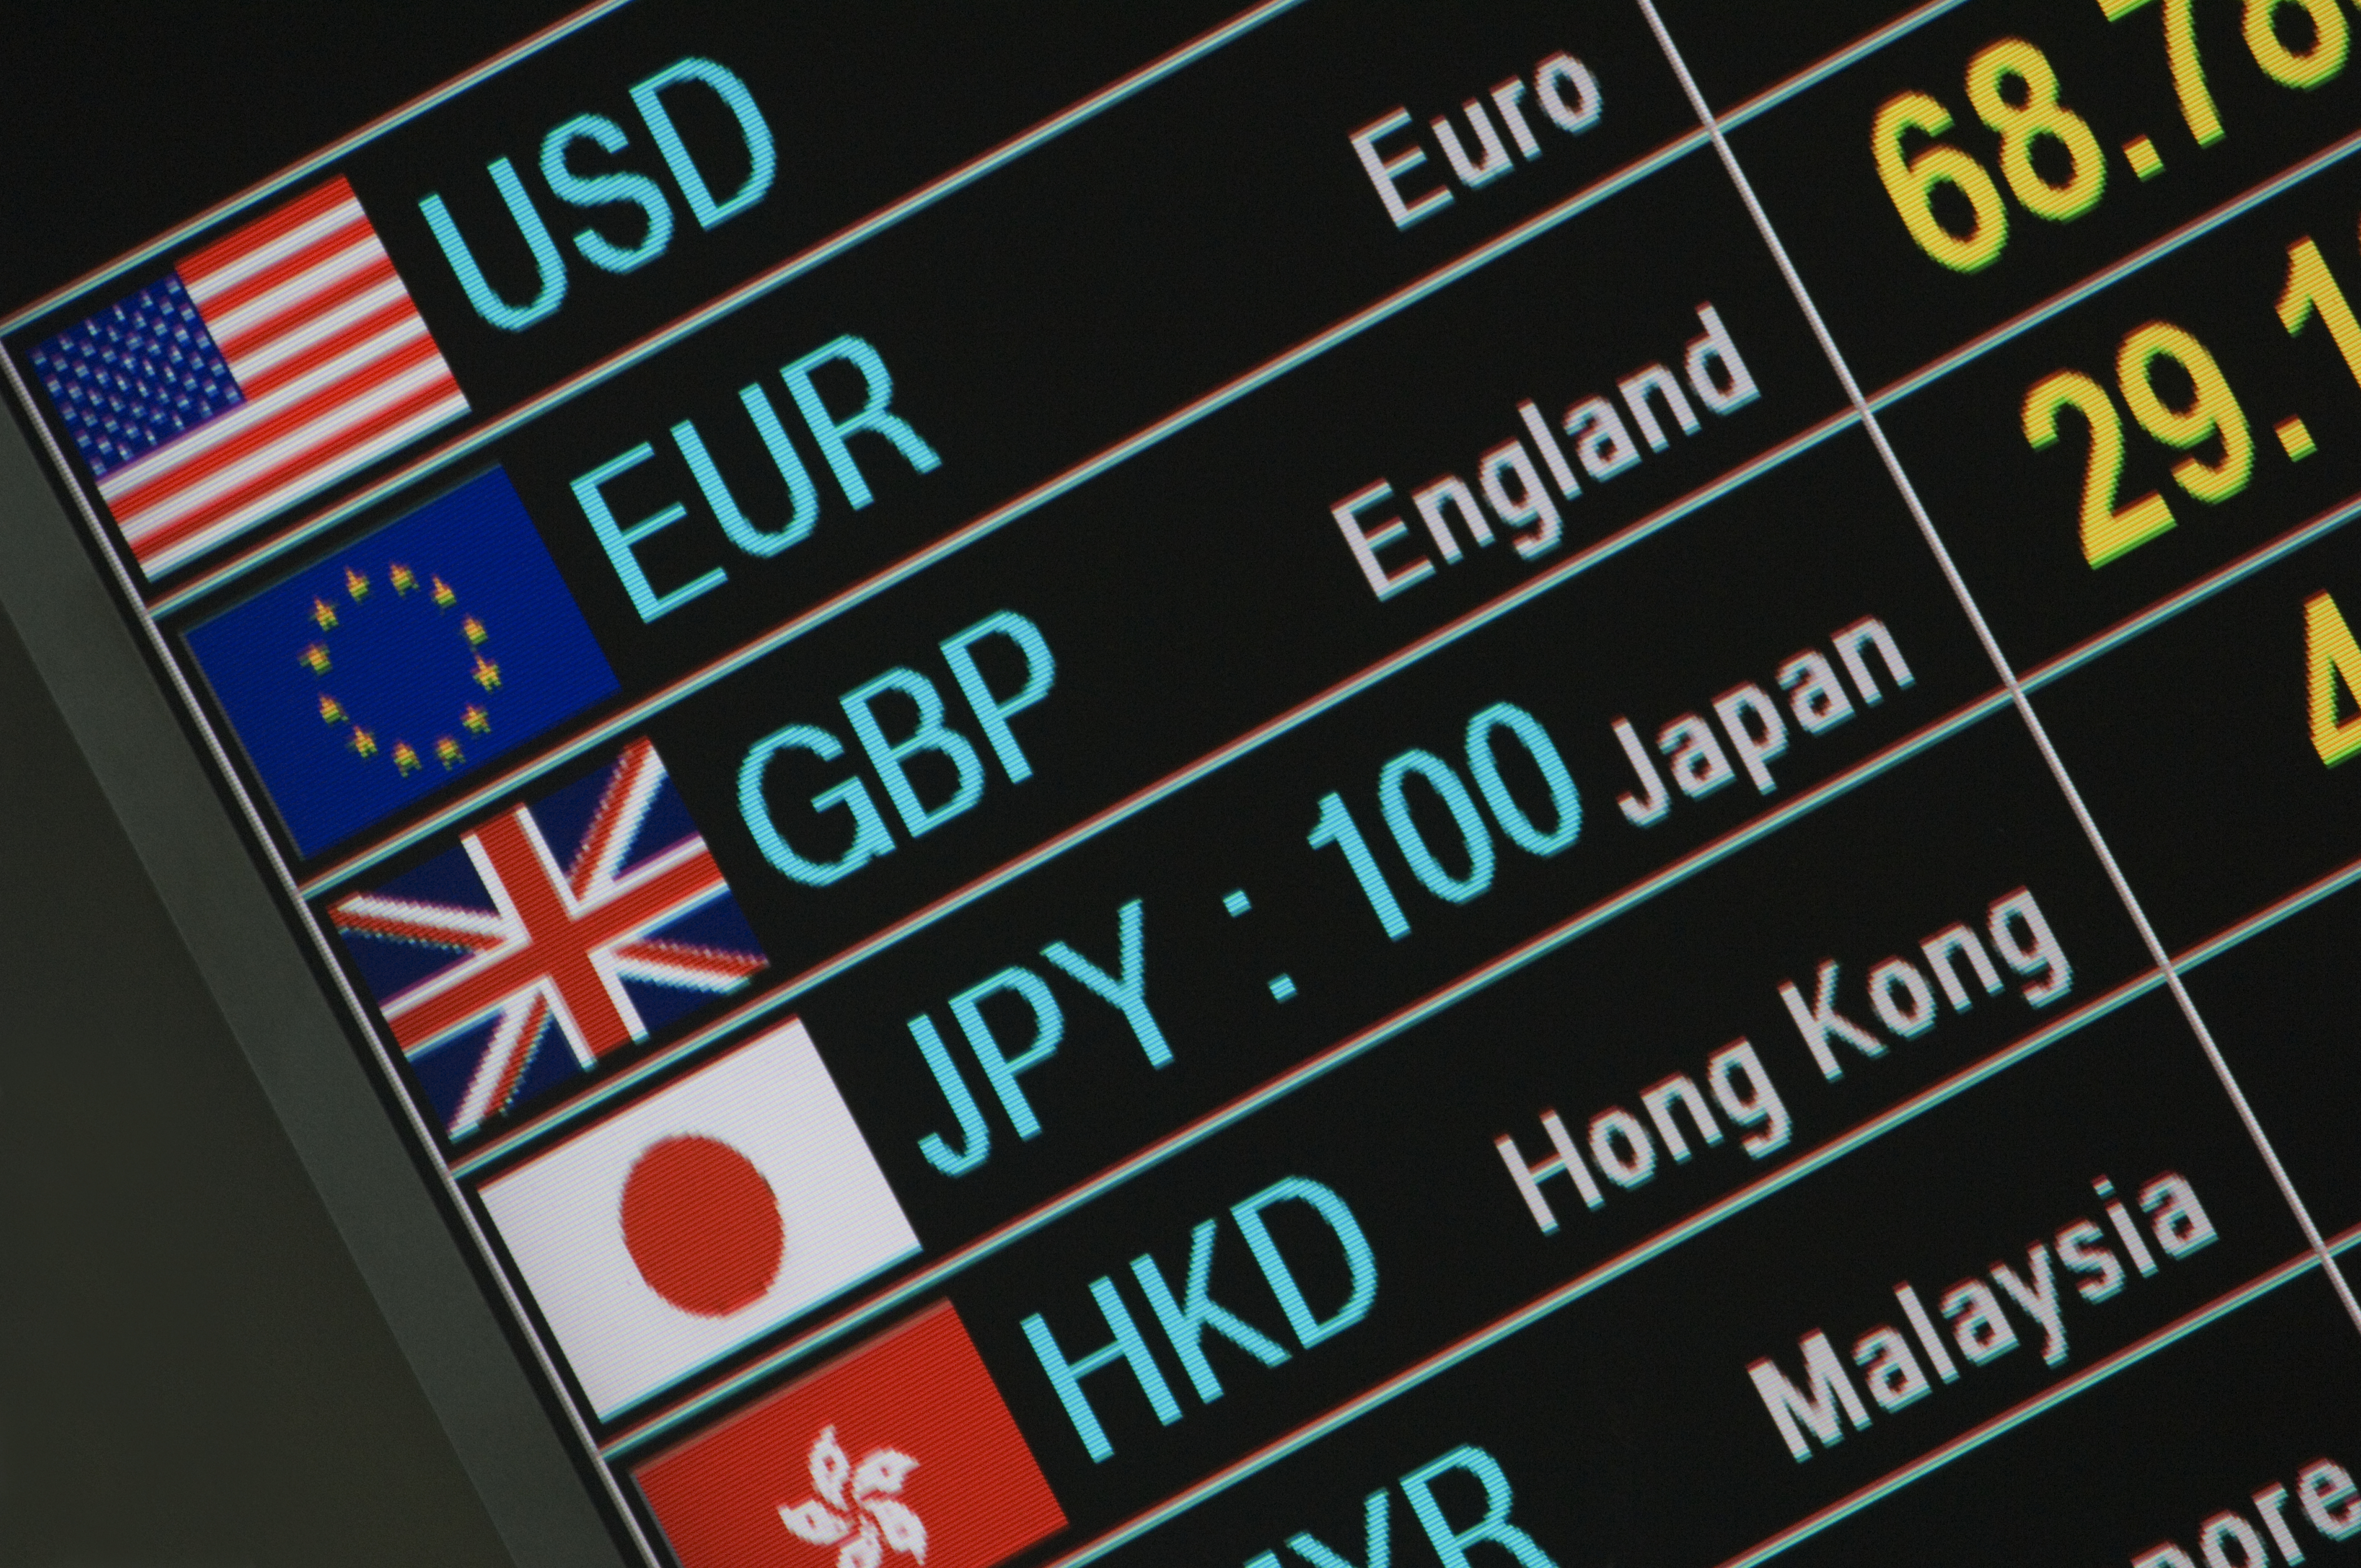
 Why you should keep an eye on the US dollar, the most important price in the world
Advice The US dollar is the most important asset in the world, dictating the prices of vital commodities. Where it goes next will determine the outlook for the global economy says Dominic Frisby.
-
 What is FX trading?
What is FX trading and can you make money from it? We explain how foreign exchange trading works and the risks
-
 The Burberry share price looks like a good bet
Tips The Burberry share price could be on the verge of a major upswing as the firm’s profits return to growth.
-
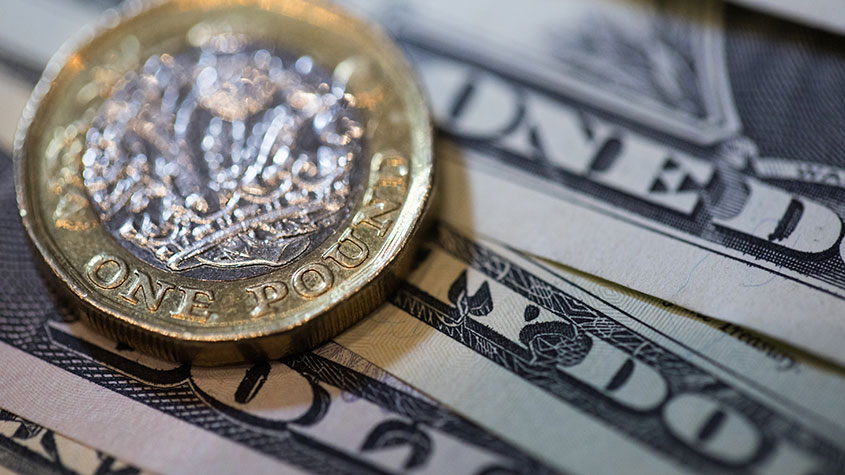 Sterling accelerates its recovery after chancellor’s U-turn on taxes
News The pound has recovered after Kwasi Kwarteng U-turned on abolishing the top rate of income tax. Saloni Sardana explains what's going on..
-
 Why you should short this satellite broadband company
Tips With an ill-considered business plan, satellite broadband company AST SpaceMobile is doomed to failure, says Matthew Partridge. Here's how to short the stock.
-
 It’s time to sell this stock
Tips Digital Realty’s data-storage business model is moribund, consumed by the rise of cloud computing. Here's how you could short the shares, says Matthew Partridge.
-
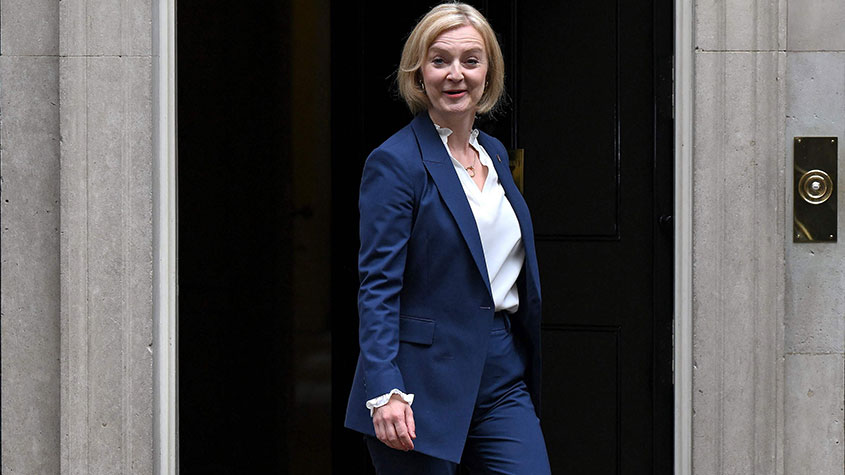 Will Liz Truss as PM mark a turning point for the pound?
Analysis The pound is at its lowest since 1985. But a new government often markets a turning point, says Dominic Frisby. Here, he looks at where sterling might go from here.


