What the simple beauty of technical analysis tells us about the tech stock bubble
The Nasdaq stock index is in an almighty bull market and may well be overvalued. But it could also go much higher. How does an investor decide what to do? Just trust in technical analysis, says Dominic Frisby.

“Oh, my goodness, the Nasdaq won’t stop going up. You’re missing out on one of the great bull markets of our lifetime if you’re not long on this one. It’s Covid-19, stupid! It’s made us use tech all the more. Google, Facebook, Amazon, Netflix – Covid has accelerated their adoption and that’s why they are going up.”
Then again… “The Nasdaq’s an almighty bubble. Prices bear no relation to earnings. Just half a dozen stocks account for more than 50% of the index. It’s way too geared. It’s going to crash.”
What’s an investor to do? That’s why I like technical analysis.
MoneyWeek
Subscribe to MoneyWeek today and get your first six magazine issues absolutely FREE

Sign up to Money Morning
Don't miss the latest investment and personal finances news, market analysis, plus money-saving tips with our free twice-daily newsletter
Don't miss the latest investment and personal finances news, market analysis, plus money-saving tips with our free twice-daily newsletter
The Nasdaq might well be overvalued and it might also go a lot higher
Both of the above arguments about the US Nasdaq stockmarket index are almost certainly true.
The Nasdaq is in an almighty bull market. Forget your V-shaped recovery. It has recovered, “V-d”, then exploded higher. Every day seems to bring another new high. And new highs lead to more new highs.
Tech stocks are so scalable. Why can we not reach the point at which 90% or more of the world’s population are using Google, Facebook, Amazon and Netflix? This enormous potential is reflected in their share prices.
And yet prices bear no relation to earnings. Tesla in particular is like a cult. It’s one of the greatest promotions mankind has ever seen. One day it is going to go belly up – manias don’t end well. So we use technical analysis. We find a trend, buy, ride the trend, and when the trend ends we get out. Technical analysis is our means.
It can be as simple as you want it to be. Just draw some lines on a chart. If the market is rising, draw them below the price. Find two or three lows, and draw the lines off those. If the market is falling, draw the lines above the price, off two or three highs. As long as the market stays above your trend line, you stay long. If the market is below your trend line, either be short – or just stay out of the market.
You place your stops below the line (or above if you’re short). But give yourself a bit of margin. Sometimes the price will violate the line, but then the uptrend will resume. If you do get stopped out and the uptrend resumes, so be it. Just go long again.
How technical analysis can cut through the arguments over fundamentals
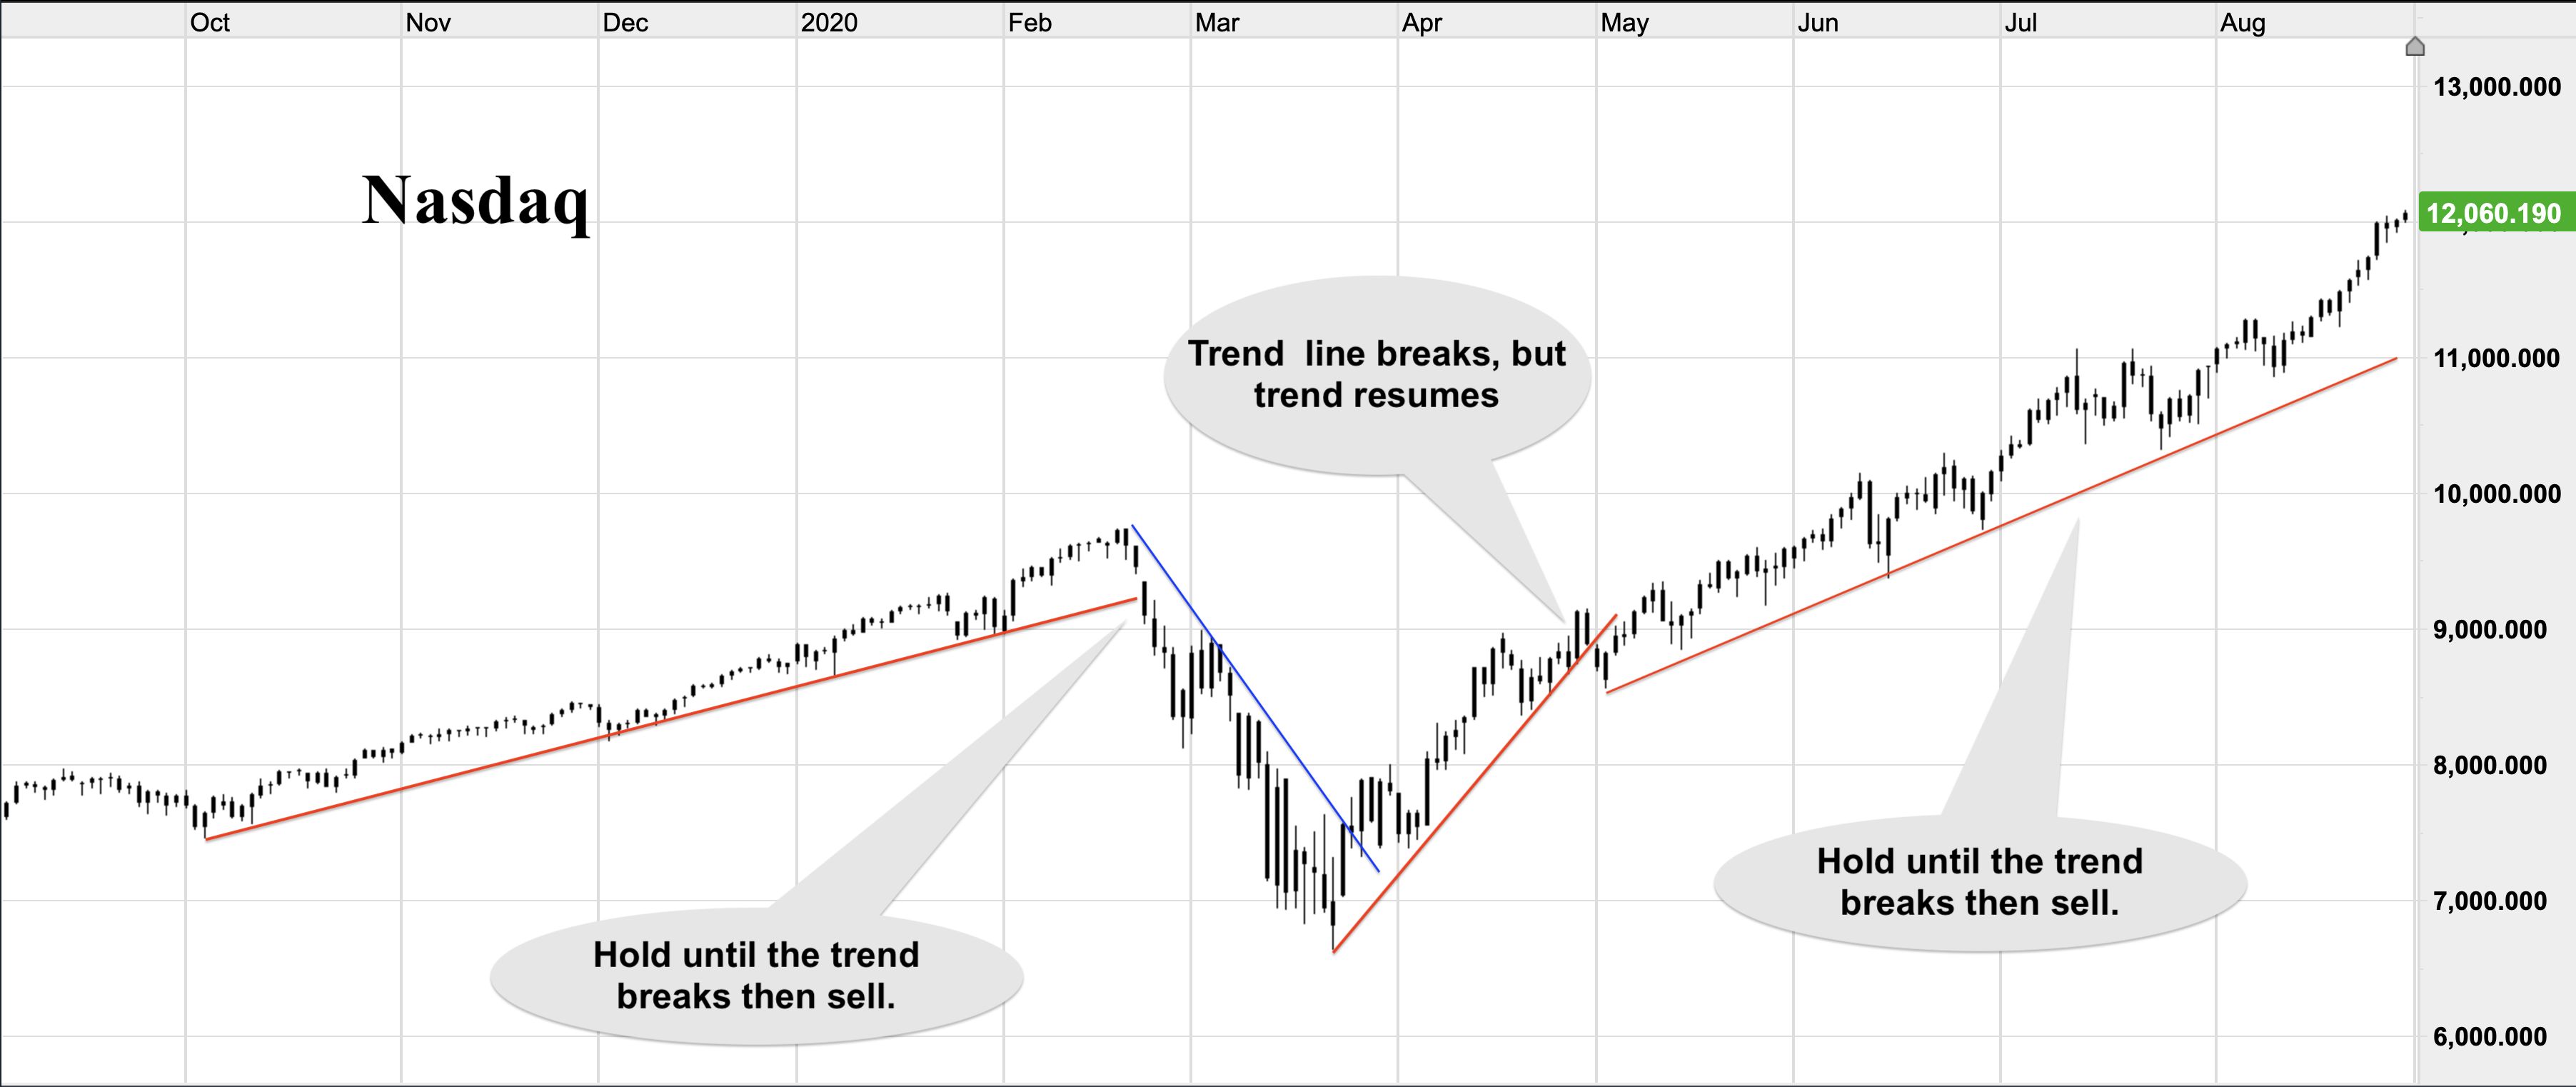
Here we see the Nasdaq over the past year.

You were long. Then the trend line broke in February. You got stopped out. In March the downtrend broke, so you went long again. That uptrend broke in April-May. If you were running tight stops, you got stopped out. If not, you held on for the resumption of the trend.
This resumption has left a very clear trend in place. As long as the Nasdaq stays above that line, you can be long. That is all you need to know.
You can leave the worrying about bubbles; the worrying about prices not reflecting earnings; the worrying about missing out on the bull run, cult-like followings, and all the rest of it to some other guy. Above the red line, I’m in. Below it, I’m out.
Trend lines are just one method. You might prefer moving averages. I love moving averages, as regular readers know. Or you can use momentum indicators and oscillators, or you can study volumes or stochastics.
It doesn’t really matter what the method is – as long as it helps you to identify the trend, keeps you in when it is going up, and gets you out when it is going down.
Often technical analysis will bear no relevance to the underlying asset. You could be long socks, bananas or Outer Mongolian corn futures. Doesn’t matter. Just be long when it’s going up. Be out – or short – when it’s going down.
If you’re geeky like me, you can use combinations of indicators. I like to use moving averages in conjunction with trend lines and support-resistance lines. That’s the most effective method I’ve discovered.
But the beauty is, it means I don’t have to think. I just follow the system. When I start thinking – that’s when the trouble starts.
Best to avoid it.
Get the latest financial news, insights and expert analysis from our award-winning MoneyWeek team, to help you understand what really matters when it comes to your finances.

-
 Average income tax by area: The parts of the UK paying the most tax mapped
The UK’s total income tax bill was £240.7 billion 2022/23, but the tax burden is not spread equally around the country. We look at the towns and boroughs that have the highest average income tax bill.
-
 BBC TV licence fee hike confirmed: can you reduce how much you pay?
The cost of a TV licence fee is set to rise by over 3%, but there are ways to reduce the bill.
-
 What's behind the big shift in Japanese government bonds?
Rising long-term Japanese government bond yields point to growing nervousness about the future – and not just inflation
-
 Why you should keep an eye on the US dollar, the most important price in the world
Advice The US dollar is the most important asset in the world, dictating the prices of vital commodities. Where it goes next will determine the outlook for the global economy says Dominic Frisby.
-
 What is FX trading?
What is FX trading and can you make money from it? We explain how foreign exchange trading works and the risks
-
 The Burberry share price looks like a good bet
Tips The Burberry share price could be on the verge of a major upswing as the firm’s profits return to growth.
-
 Sterling accelerates its recovery after chancellor’s U-turn on taxes
News The pound has recovered after Kwasi Kwarteng U-turned on abolishing the top rate of income tax. Saloni Sardana explains what's going on..
-
 Why you should short this satellite broadband company
Tips With an ill-considered business plan, satellite broadband company AST SpaceMobile is doomed to failure, says Matthew Partridge. Here's how to short the stock.
-
 It’s time to sell this stock
Tips Digital Realty’s data-storage business model is moribund, consumed by the rise of cloud computing. Here's how you could short the shares, says Matthew Partridge.
-
 Will Liz Truss as PM mark a turning point for the pound?
Analysis The pound is at its lowest since 1985. But a new government often markets a turning point, says Dominic Frisby. Here, he looks at where sterling might go from here.
