Everybody hates the euro now. Time to buy
Despite the prospect of massive money-printing by the ECB, the euro could be teed up for a big rally, says John C Burford.
Get the latest financial news, insights and expert analysis from our award-winning MoneyWeek team, to help you understand what really matters when it comes to your finances.
You are now subscribed
Your newsletter sign-up was successful
Want to add more newsletters?

Twice daily
MoneyWeek
Get the latest financial news, insights and expert analysis from our award-winning MoneyWeek team, to help you understand what really matters when it comes to your finances.

Four times a week
Look After My Bills
Sign up to our free money-saving newsletter, filled with the latest news and expert advice to help you find the best tips and deals for managing your bills. Start saving today!
The European Central Bank (ECB) has a very simple plan: print lots of euros. It's going to print €1.1trn between now and 2016.
The eurozone is getting into the swing of money printing, just as the US stops doing it. It can only mean one thing. The euro is going down relative to the dollar, right?
Well, I'm not so sure.
MoneyWeek
Subscribe to MoneyWeek today and get your first six magazine issues absolutely FREE

Sign up to Money Morning
Don't miss the latest investment and personal finances news, market analysis, plus money-saving tips with our free twice-daily newsletter
Don't miss the latest investment and personal finances news, market analysis, plus money-saving tips with our free twice-daily newsletter
What if the market was expecting money printing? There are plenty of sophisticated investors and traders out there who have much more inside knowledge of the market than you or me.
These guys are only too willing to take your money off you! Some of them even get tipped off early by governments and central banks.
As a trader, you have to look behind the superficial story. Just because the ECB is about to start printing money, it doesn't automatically follow that the euro is about to fall in value. Thanks to insiders, and smart traders, all of next year's money printing might already be reflected in today's price.
So today, I want to examine the possibility that the euro is now teed up for a big rally.
Everyone's down on the euro
This negative sentiment can also be seen by the number of long and short positions in the market. To find those numbers, I turn to my trusty commitment of traders data (which can be found at www.cftc.gov).
Here is the latest commitment of traders data for EUR/USD:
| (Contracts of EUR 125,000) | Row 0 - Cell 1 | Row 0 - Cell 2 | Row 0 - Cell 3 | Open interest: 450,262 | ||||
| Commitments | ||||||||
| 52,047 | 232,777 | 9,226 | 350,433 | 114,236 | 411,706 | 356,239 | 38,556 | 94,023 |
| Changes from 01/13/15 (Change in open interest: 27,836) | ||||||||
| 1,189 | 14,068 | 2,115 | 18,499 | 7,527 | 21,803 | 23,710 | 6,033 | 4,126 |
| Percent of open in terest for each category of traders | ||||||||
| 11.6 | 51.7 | 2.0 | 77.8 | 25.4 | 91.4 | 79.1 | 8.6 | 20.9 |
| Number of traders in each category (Total traders: 237) | ||||||||
| 42 | 101 | 25 | 55 | 63 | 109 | 178 | Row 8 - Cell 7 | Row 8 - Cell 8 |
Why did they do this? Well, hedge funds are trend-followers. This means that they bet in the same direction that the market is moving, whether up or down. A what a trend the euro was to ride!
But on Sunday, as the result of the Greece election was decided, the euro made a low at the 1.11 to the dollar and then started to rally.
The Fibonacci reading is telling me one thing: the Euro will rally
And the Fibonacci 62% level is a very important one in my book. It often represents major support or resistance. At 1.11, the euro is being supported by the 62% Fibonacci level. That tells me the euro is about to rally.
What about tramlines? Well, as you can see in the 15-minute scale chart below, I had an excellent pair of tramlines in the works yesterday afternoon:
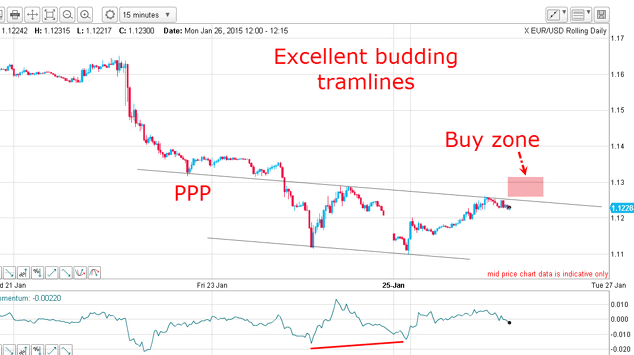
I had a great prior pivot point (PPP) on the upper line, which is an important indicator that a tramline is reliable. Right now, the upper line has only two touch points so far, as does my lower tramline. Remember, ideally I would like to see at least three touch points on one of the lines. But this is a promising position.
If the market did poke above the upper tramline, it would be a sign that the market was starting to rally. And that would mean the ideal low-risk long euro trade was inside the pink, buy zone.
How did the situation develop?
A third tramline explained when to sell
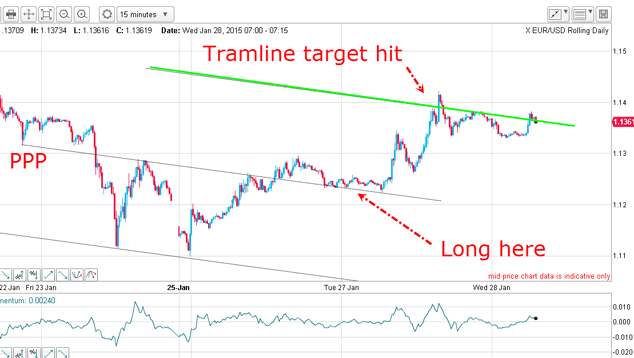
Well, the market did break above the centre tramline, came back for a on that same tramline and moved smartly back up.
That kiss was all the confirmation I needed to tell me that the trend was now headed upwards.
How high would the market go? At that point I established a third tramline (shown in the chart in green), which is of equal distance from the centre tramline.
It worked a treat. The market hit my upper tramline target where a cool 150 pips plus profit could have been taken. Nice work!
Get the latest financial news, insights and expert analysis from our award-winning MoneyWeek team, to help you understand what really matters when it comes to your finances.
John is is a British-born lapsed PhD physicist, who previously worked for Nasa on the Mars exploration team. He is a former commodity trading advisor with the US Commodities Futures Trading Commission, and worked in a boutique futures house in California in the 1980s.
He was a partner in one of the first futures newsletter advisory services, based in Washington DC, specialising in pork bellies and currencies. John is primarily a chart-reading trader, having cut his trading teeth in the days before PCs.
As well as his work in the financial world, he has launched, run and sold several 'real' businesses producing 'real' products.
-
 Average UK house price reaches £300,000 for first time, Halifax says
While the average house price has topped £300k, regional disparities still remain, Halifax finds.
-
 Barings Emerging Europe trust bounces back from Russia woes
Barings Emerging Europe trust has added the Middle East and Africa to its mandate, delivering a strong recovery, says Max King
-
 Investors dash into the US dollar
News The value of the US dollar has soared as investors pile in. The euro has hit parity, while the Japanese yen and the Swedish krona have fared even worse.
-
 Could a stronger euro bring relief to global markets?
Analysis The European Central Bank is set to end its negative interest rate policy. That should bring some relief to markets, says John Stepek. Here’s why.
-
 A weakening US dollar is good news for markets – but will it continue?
Opinion The US dollar – the most important currency in the world – is on the slide. And that's good news for the stockmarket rally. John Stepek looks at what could derail things.
-
 How the US dollar standard is now suffocating the global economy
News In times of crisis, everyone wants cash. But not just any cash – they want the US dollar. John Stepek explains why the rush for dollars is putting a big dent in an already fragile global economy.
-
 The pound could hit parity with the euro – but if it does, buy it
Features Anyone visiting the continent this summer will have been in for a rude shock at the cash till, says Dominic Frisby. But the pound won't stay down forever.
-
Gold’s rally should continue
Features Matthew Partridge looks at where the gold price is heading next, and what that means for your online trading.
-
 Prudent trades in Prudential
Features John C Burford shows how his trading methods can be used for more than just indices and currencies. They work for large-cap shares too.
-
 Did you find the path of least resistance in EUR/USD?
Features John C Burford outlines a trade in the euro vs the dollar in the wake of the US Federal Reserve’s most recent announcement.