You are now subscribed
Your newsletter sign-up was successful
Want to add more newsletters?

Twice daily
MoneyWeek
Get the latest financial news, insights and expert analysis from our award-winning MoneyWeek team, to help you understand what really matters when it comes to your finances.

Four times a week
Look After My Bills
Sign up to our free money-saving newsletter, filled with the latest news and expert advice to help you find the best tips and deals for managing your bills. Start saving today!
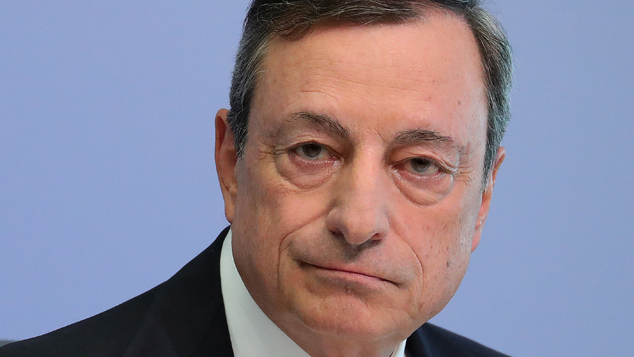
Stockmarkets rallied hard on Friday following the Bank of Japan's (BOJ) desperate move to implement negative interest rates. This followed European Central Bank boss Mario Draghi's equally hopeful last throw of the dice in December to force EU headline consumer inflation up off the zero line.
The central banks' obsession with their 2% target has always been something of a mystery to me. When consumers are finally enjoying stable (and lower, in the case of energy) prices, why would anyone want to increase them again, given that wages and salaries remain stable? Of course, I do see why. It is because they want asset prices to be keptelevated. After all, central banks have gorged on bond buying and do not want to see their values plummet.
MoneyWeek
Subscribe to MoneyWeek today and get your first six magazine issues absolutely FREE

Sign up to Money Morning
Don't miss the latest investment and personal finances news, market analysis, plus money-saving tips with our free twice-daily newsletter
Don't miss the latest investment and personal finances news, market analysis, plus money-saving tips with our free twice-daily newsletter
But I flagged this move beforehand.
In my postof last Wednesday, I supported my forecast for an imminent rally by invoking a classic example of the 'magazine cover indicator' (MCI) from Investors Chronicle: "Spotting sell signals how to profit from short selling".Remember, the MCI is a contrary indicator and indicates a probablechange in trend.
In fact, that wasn't the only example I found in recent days. As I scanned the media I found several more prominent articles explaining how to short stocks. To me, that indicated I was on the right track, bolstered as I was by my chart-reading analysis.
This is what I wrote on Wednesday: "Now their readership is short selling, this is the ideal time for a huge rally to take them out. The market's cruelty is almost beautiful to observe." And the market delivered right on cue.
Confirming the bearish sentiment among financial journalists, I mentioned that the Daily Sentiment Index (DSI) on the S&P 500 index has recently plunged to fewer than 10% bulls.
With this overwhelming bearish tone, the market was ripe for a huge counter-trend rally to take out many of the recent shorts.
Having prepared myself for this anticipated rally phase (and having taken partial profits on my shorts earlier), my task now is to identify its top. Because if I can do that successfully, I will have another great short trade working.
Let's look at the daily S&P chart with my Elliott wave labels:
It closely resembles the Dow chart I captured before the big Friday up day:
Here, my blue tramlines are a little more convincing. But the theme remains the same the rally should terminate in the area marked (or below).
In the S&P chart, I have a complete five down with a momentum divergence at the wave 5 low. Now the market is making an A-B-C relief rally and currently, is putting in the C wave.
And if I am right, the market is getting teed up for another huge leg down.
Time to take a step back and look at the bigger picture. Here is the Dow chart showing the May 2015 all-time high:
When enough shorts have been squeezed, the market should make its wave 4 high and resume its decline.
But the key level to watch is the pink area. If the market can break solidly below that, it would confirm the first five down (small red) to show the main trend really is down.
But there is another possibility (there always is!) and it is this: if the market does not violate that key area and moves higher to above the 17,000 level, the bear will be forced back into his cave. And the all-time high of 18,365 would be in danger of being exceeded.
I have maintained the view that during this bear market, small caps will be weaker than the Dow and S&P large caps as riskier stocks will be shunned in favour of the 'safe' large caps. Here is the Russell 2000 index of small caps:
The current rally has hit the Fibonacci 38% level, way short of the near-50% level reached by the S&P. To me, that indicates that in the next bear phase, the small caps will lead the way again.
It is a little-known fact that whenever the Fed announced its various QE (quantitative easing) and ZIRP (zero interest rate policy) schemes since 2008, the US stockmarket made a significant high and sold off. It was the classic 'buy the rumour, sell the news' result. Will history repeat for the BOJ?
It would be a good time to do it here is the Nikkei 225 hourly chart:
There is a lovely A-B-C rally right to the Fibonacci 50% level. Could this be it?
-
 Average UK house price reaches £300,000 for first time, Halifax says
While the average house price has topped £300k, regional disparities still remain, Halifax finds.
-
 Barings Emerging Europe trust bounces back from Russia woes
Barings Emerging Europe trust has added the Middle East and Africa to its mandate, delivering a strong recovery, says Max King


-
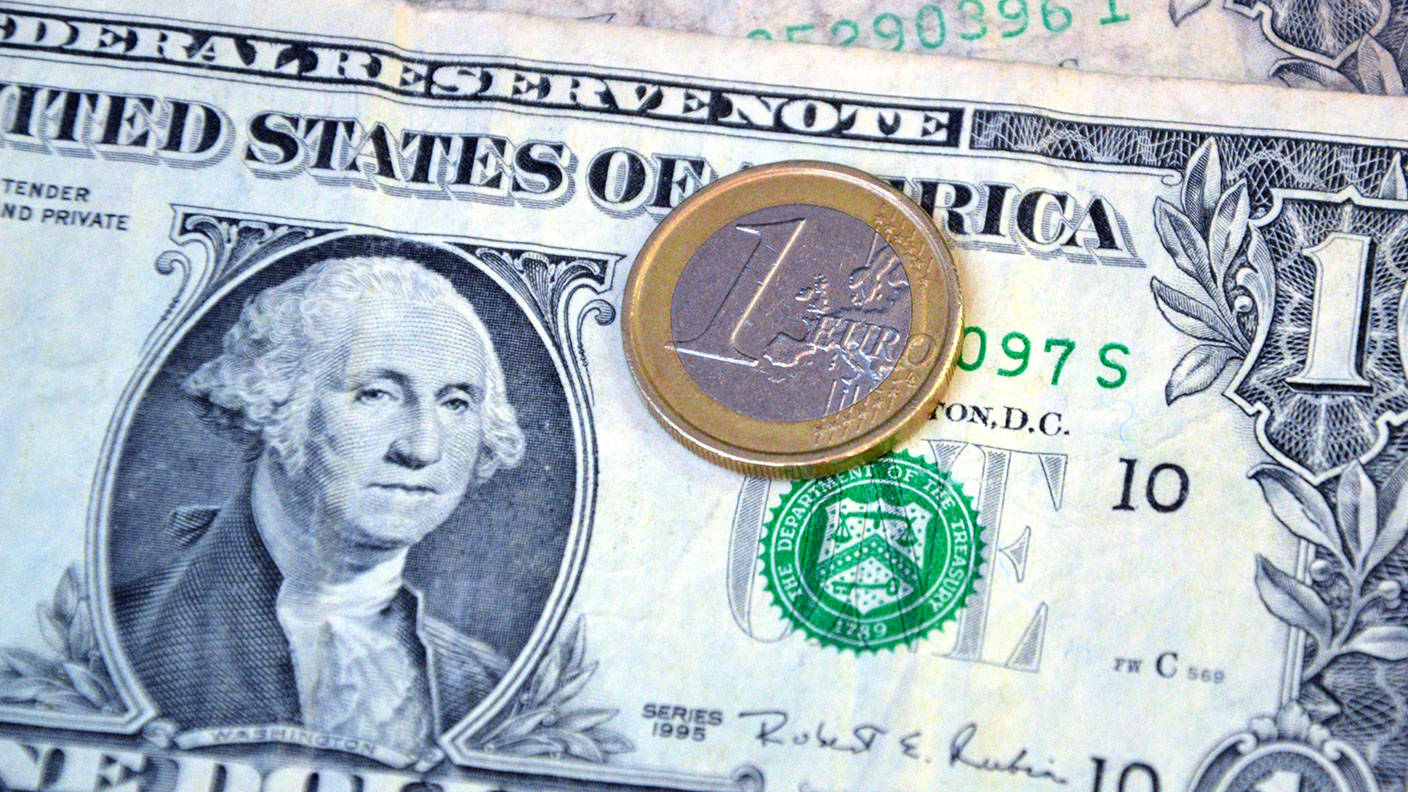
 Investors dash into the US dollar
News The value of the US dollar has soared as investors pile in. The euro has hit parity, while the Japanese yen and the Swedish krona have fared even worse.
-
 Could a stronger euro bring relief to global markets?
Analysis The European Central Bank is set to end its negative interest rate policy. That should bring some relief to markets, says John Stepek. Here’s why.
-
 A weakening US dollar is good news for markets – but will it continue?
Opinion The US dollar – the most important currency in the world – is on the slide. And that's good news for the stockmarket rally. John Stepek looks at what could derail things.
-
 How the US dollar standard is now suffocating the global economy
News In times of crisis, everyone wants cash. But not just any cash – they want the US dollar. John Stepek explains why the rush for dollars is putting a big dent in an already fragile global economy.
-
 The pound could hit parity with the euro – but if it does, buy it
Features Anyone visiting the continent this summer will have been in for a rude shock at the cash till, says Dominic Frisby. But the pound won't stay down forever.
-
 Gold’s rally should continue
Features Matthew Partridge looks at where the gold price is heading next, and what that means for your online trading.
-
 Prudent trades in Prudential
Features John C Burford shows how his trading methods can be used for more than just indices and currencies. They work for large-cap shares too.
-
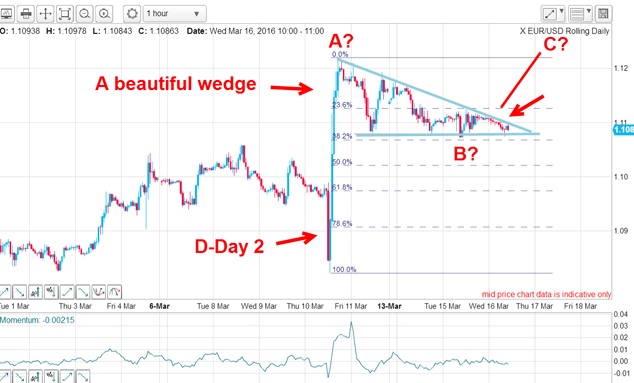 Did you find the path of least resistance in EUR/USD?
Features John C Burford outlines a trade in the euro vs the dollar in the wake of the US Federal Reserve’s most recent announcement.


