History repeats itself in the Dow Jones
Every time the Dow stumbles, the 'buy the dip' crowd is out in force to put the market back on its feet, says John C Burford.
Get the latest financial news, insights and expert analysis from our award-winning MoneyWeek team, to help you understand what really matters when it comes to your finances.
You are now subscribed
Your newsletter sign-up was successful
Want to add more newsletters?

Twice daily
MoneyWeek
Get the latest financial news, insights and expert analysis from our award-winning MoneyWeek team, to help you understand what really matters when it comes to your finances.

Four times a week
Look After My Bills
Sign up to our free money-saving newsletter, filled with the latest news and expert advice to help you find the best tips and deals for managing your bills. Start saving today!
Today is the day Fed watchers have been waiting for with bated breath Janet Yellen, the US Federal Reserve chairman, is scheduled to utter words at 3pm UK time that they believe will put another rocket under stock markets. By the time you read this, the words will probably be out there for all to digest.
Naturally, the key question they want answered is this: what is the Fed's intention regarding the Fed Funds short-term interest rates, which have been on the floor since the ZIRP policy started.
Of one thing I am sure: Yellen's statements will be couched in the usual mumbo-jumbo that Fed chairmen are known for.
MoneyWeek
Subscribe to MoneyWeek today and get your first six magazine issues absolutely FREE

Sign up to Money Morning
Don't miss the latest investment and personal finances news, market analysis, plus money-saving tips with our free twice-daily newsletter
Don't miss the latest investment and personal finances news, market analysis, plus money-saving tips with our free twice-daily newsletter
I have news for the Fed-watchers: interest rates are set by Mr Market, not Ms Yellen and pals. What Yellen says will have little bearing on the path interest rates will take, except possibly in the very near-term as emotions run high for a few hours.
Actually, I am hoping for a bullish/dovish' statement (along with every investor and their dog), but for the contrary reason that it would set up the possibility for a buy the rumour, sell the news' event. It would cap off a most remarkable rally off the 8 August low a rally I alluded to in my last post on the Dow of 15 August.
Proof that history does sometimes repeat
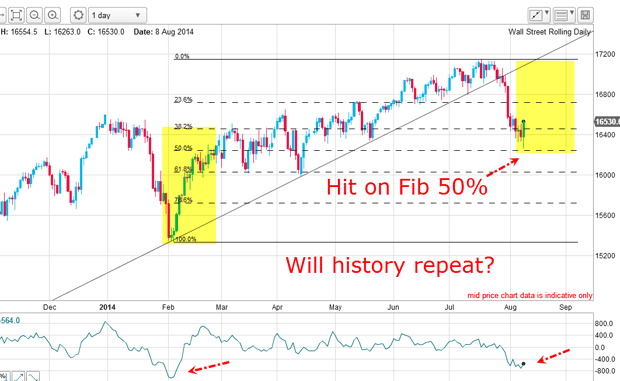
The big decline of the previous week was starting to turn around from a precise hit on the Fibonacci 50% level. The market was possibly starting a rebound rally then.
I noted the possible similarity between the position of the market then and that in February, when the market staged a hefty rally and went on to make new highs.
And that is precisely what has transpired a repeat of history. Here is the updated chart:
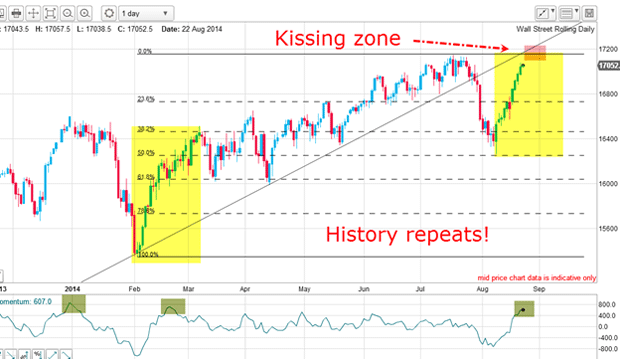
The 'buy the dip' crowd were aggressively out in force, as they have been since 2009 and pushed stocks back up. This was a vivid demonstration that history does sometimes repeat.
The market offers an excellent trade setup
Momentum is already back up at levels where previous tops were made. Although it is possible that the rally could continue its relentless climb from here, the odds are swiftly diminishing for this outcome.
I have noted that when the Fed had previously made a much-anticipated announcement, the initial reaction was generally bullish. But within a short period, the market made a major top and a substantial decline ensued big enough for a very profitable short trade.
I wonder if a similar setup will present this time?
Are we getting close to the top?
This index has been the strongest of all US indexes as speculation has concentrated on tech shares. The faith investors/gamblers are putting in the ability of projected new developments in tech and biotech (and social media) to produce years and years of above-average dividend growth is astonishing it is a veritable mania.
Here is the last wave up in the Nasdaq from the April low:
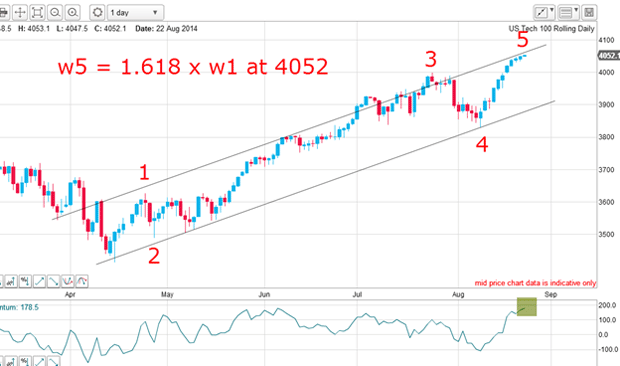
There is a clear impulsive five-wave pattern with a long and strong wave 3. The August rally is my wave 5 (and has had no down day in 11 trading days) and now momentum is practically off the scale.
The universal expectation that the Fed will keep supporting shares has reached fever pitch. The belief is that the Fed will not allow a sell-off in shares, as that is the main arena for wealth-creation that they support. We shall see whether or not the Fed has such amazing powers when the next sell-off gets under way.
The interesting feature of the chart is that at the current 4,052 level, wave 5 = 1.618 times wave 1, which is a common wave relationship. Also, the market has met my upper tramline a region of considerable resistance.
If my Elliott wave count is correct, the top cannot be far away.
Get the latest financial news, insights and expert analysis from our award-winning MoneyWeek team, to help you understand what really matters when it comes to your finances.
John is is a British-born lapsed PhD physicist, who previously worked for Nasa on the Mars exploration team. He is a former commodity trading advisor with the US Commodities Futures Trading Commission, and worked in a boutique futures house in California in the 1980s.
He was a partner in one of the first futures newsletter advisory services, based in Washington DC, specialising in pork bellies and currencies. John is primarily a chart-reading trader, having cut his trading teeth in the days before PCs.
As well as his work in the financial world, he has launched, run and sold several 'real' businesses producing 'real' products.
-
 Average UK house price reaches £300,000 for first time, Halifax says
While the average house price has topped £300k, regional disparities still remain, Halifax finds.
-
 Barings Emerging Europe trust bounces back from Russia woes
Barings Emerging Europe trust has added the Middle East and Africa to its mandate, delivering a strong recovery, says Max King
-
 The challenge with currency hedging
A weaker dollar will make currency hedges more appealing, but volatile rates may complicate the results
-
 It's time to back the yen, says Dominic Frisby
The Japanese yen has been weak for a long time, says Dominic Frisby. That may soon change.
-
 Why a strong dollar hurts – and what you can do about it
Analysis The US dollar is at its strongest level in 20 years. That’s bad news for most investment assets, says John Stepek – here’s why
-
 Could a stronger euro bring relief to global markets?
Analysis The European Central Bank is set to end its negative interest rate policy. That should bring some relief to markets, says John Stepek. Here’s why.
-
 HubSpot: a tech stock set to tumble
Tips US tech stocks have had a fantastic couple of years. But this year is unlikely to be so bullish for high-fliers that can’t turn big profits.
-
 What does the future hold for central bank digital currencies?
Briefings Many of the world's central banks – including the Bank of England – have expressed an interest in creating their own digital currencies. Shivani Khandekar looks at the state of play in central bank digital currencies.
-
 Will the market crash again? Watch the US dollar for clues
Opinion One of the biggest driving factors behind the market’s recent big sell-off was the bounce in the US dollar. John Stepek explains why the price of the dollar matters so much, and why investors should keep a keen eye on it.
-
 The US dollar’s days as the world's most important currency are numbered – it’s official
Features Central bankers reckon the dollar's days as the world’s reserve currency are numbered. But what could replace it? John Stepek takes a look at Bank of England governor Mark Carney's cunning plan.