The Dow rallies and follows my script
Using Elliot wave theory and tramline trading, John C Burford shows how the relief rally in the Dow Jones was entirely predictable.
Get the latest financial news, insights and expert analysis from our award-winning MoneyWeek team, to help you understand what really matters when it comes to your finances.
You are now subscribed
Your newsletter sign-up was successful
Want to add more newsletters?

Twice daily
MoneyWeek
Get the latest financial news, insights and expert analysis from our award-winning MoneyWeek team, to help you understand what really matters when it comes to your finances.

Four times a week
Look After My Bills
Sign up to our free money-saving newsletter, filled with the latest news and expert advice to help you find the best tips and deals for managing your bills. Start saving today!
The Dow is in rally mode this week, and today I want to show how, by using basicElliott wave theoryconcepts (as I do in mytramlinemethod), this rally was entirely foreseeable.
My best guess scenario

The long and strong nature of the decline identified that part as my third wave. Working backwards, placing labels on waves 1 and 2 was quite simple. So far, so good.
If I had found the bottom of wave 3, which was likely, based on the largepositive momentum divergenceas marked, I could expect wave 4 to be a complex affair (they usually are!).
MoneyWeek
Subscribe to MoneyWeek today and get your first six magazine issues absolutely FREE

Sign up to Money Morning
Don't miss the latest investment and personal finances news, market analysis, plus money-saving tips with our free twice-daily newsletter
Don't miss the latest investment and personal finances news, market analysis, plus money-saving tips with our free twice-daily newsletter
Thus, I expected wave 4 up to terminate and then see a complex move down to a new low in my final wave 5. When this fifth wave terminated, I then expected a relief rally, hopefully in an A-B-C form. Ideally, the C wave would terminate at or near to a Fibonacci level.
And this morning, we are in wave 4 up. So, where will it end?
The rally has not even made it to the first Fibonacci 23% level yet and remains weak, so far. And with momentum at overbought levels, the rally may not have much further to run before wave 5 gets under way, taking the market below my wave 3 low.That is my best guess scenario.
I also had the option of going long in anticipation of a good move up.
You have to get the Elliott wave labels right!

Right on cue, the market moved to a new low last Friday on a large positive momentum divergence and promptly reversed sharply upwards late on Friday.
That caught a lot of shorts flat-footed, coming at a very inconvenient time when many had taken their eyes off the market and were headed home. But traders who were following their Elliott waves were ready for that move and were busy taking profits on their shorts.
Members who have graduated from myTrade for Profit Academy,for example, would have been fully prepared for this.
There was another reason to believe the decline would end in the 16,300 area it lies on theFibonacci50% retrace of the big move up off the major February low (see next chart)
This week, the relief rally has moved on and it has a clear A-B-C feel and a looming large negative momentum divergence. Note the A-B-C nature of my wave B a textbook pattern for a B wave. The rally could peter out at any time from here.
Did history repeat itself?

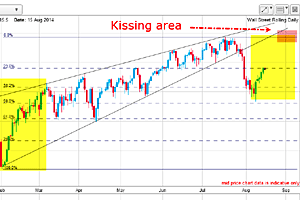
I noted the possible similarity between the rally off the February low and the current position. Last time, the market staged a huge rally, which eventually took it to new highs. I asked the question: will history repeat?
Here is that chart updated:

It is certainly looking like it is following the previous example, so far.
Of course, the possibility exists that the rally could extend to a kiss on the underside of the wedge line (pink zone) and that would put the market at a new high.
But there is one significant difference between February and now: back then, there was little in the way of chart resistance on the way up. Now, there is major resistance provided by the choppy waves in the June-July period.
That could put the brakes on the rally at any stage from here.
Get the latest financial news, insights and expert analysis from our award-winning MoneyWeek team, to help you understand what really matters when it comes to your finances.
John is is a British-born lapsed PhD physicist, who previously worked for Nasa on the Mars exploration team. He is a former commodity trading advisor with the US Commodities Futures Trading Commission, and worked in a boutique futures house in California in the 1980s.
He was a partner in one of the first futures newsletter advisory services, based in Washington DC, specialising in pork bellies and currencies. John is primarily a chart-reading trader, having cut his trading teeth in the days before PCs.
As well as his work in the financial world, he has launched, run and sold several 'real' businesses producing 'real' products.
-
 Ayatollah Ali Khamenei: Iran’s underestimated chief cleric
Ayatollah Ali Khamenei is the Iranian regime’s great survivor portraying himself as a humble religious man while presiding over an international business empire
-
 'AI will change our world in more ways than we can imagine'
Interview Rob Arnott of Research Affiliates talks to Andrew Van Sickle about the AI bubble, the impact of tariffs on inflation and the outlook for gold and China