Should traders sell in July, and wave goodbye?
Stock markets plummeted last week. But if you want to know why, says John C Burford - you only have to look at the charts.
Get the latest financial news, insights and expert analysis from our award-winning MoneyWeek team, to help you understand what really matters when it comes to your finances.
You are now subscribed
Your newsletter sign-up was successful
Want to add more newsletters?

Twice daily
MoneyWeek
Get the latest financial news, insights and expert analysis from our award-winning MoneyWeek team, to help you understand what really matters when it comes to your finances.

Four times a week
Look After My Bills
Sign up to our free money-saving newsletter, filled with the latest news and expert advice to help you find the best tips and deals for managing your bills. Start saving today!
Stocks markets are front page news now and I shall cover them much more often in my Trader posts.
Remember the 'Sell in May, and go away' episode this year? Every year in May, pundits come out of the woodwork and wonder if this infamous advice should be followed by investors seeking to dodge stock market declines in the summer.
If memory serves, the consensus last May was to ignore it and keep buying shares for the well-rehearsed reasons that the Fed was keeping interest rates ultra-low, and Western economies were reaching escape velocity' and did not need the Fed's QE (quantitative easing) support anymore.
MoneyWeek
Subscribe to MoneyWeek today and get your first six magazine issues absolutely FREE

Sign up to Money Morning
Don't miss the latest investment and personal finances news, market analysis, plus money-saving tips with our free twice-daily newsletter
Don't miss the latest investment and personal finances news, market analysis, plus money-saving tips with our free twice-daily newsletter
The markets did make further upside progress since May to the tune of around 4% in the Dow. The sell in May' advice was looking decidedly foolish.
As it has turned out, these assumptions were entirely accurate. Interest rates have hardly moved and the UK economy is growing quickly with the US economy chugging along with no apparent shocks. That was a great forecast.
But the stock market is not the same thing as the economy!
So here we are in early August and last week, markets plummeted. What a difference a week makes. The Russell 2,000 is down 8% from its July high, and interest rates and the economy haven't budged. So what gives?
My advice to pundits: look at the charts!
So I have coined a new axiom: 'Sell in July, and wave goodbye'.
Will it catch on? The time-honoured May adage is alive for a reason: markets usually did take a break for the summer in pre-electronic trading days. It was usually prudent to sell in May and return on St Leger's Day. It is by no means great investment advice today.
Are there any precedents for major tops to occur in July? As it turns out, not many, but there are several major tops occurring in the third quarter in the past 50 years, including tops in 1976, 1987, 1989, 1990, 1997, 1998 and 1999.
Personally, the 1987 October crash was especially memorable, because I was with a trading firm in Los Angeles at the time and watched the S&P futures in freefall on Black Monday on my blinking green Quotron screen.
Selling was so intense from programme trading' there were periods when there were no bids at all, just masses of offers. It was sheer panic and I have never seen anything like it since (although I expect to do so again).
Watch out for congestion zones
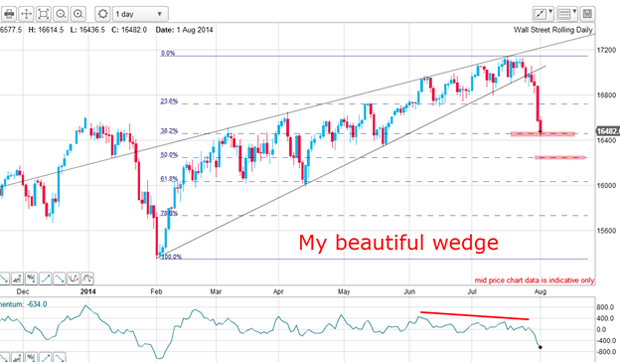
A rising wedge breakout is a very bearish omen, especially when it comes at the end of a long and strong bull market (opposite for bear markets).
The short-term wedge has already broken down:

Here it is and shows the market has fallen rapidly to the Fibonacci 38% support level. The question is this: will this support be enough to produce a relief rally of some kind?
Just glancing at the chart, the market has now entered chart support provided by the congested trading zone in the March-May period. Congestion zones offer support from the traders who shorted the market in that period, but saw the market go against them in June and July. With the sudden drop back to their entry point, they are only too happy to grab this lifeline and cover their shorts for a wash trade.
You should always keep an eye on congestion zones, because they can offer further clues where markets may pause and where short-term profits can be taken.
But if support is weak here, my next target is the Fibonacci 50% level in the 16,200 area.
Here's what's happening right now

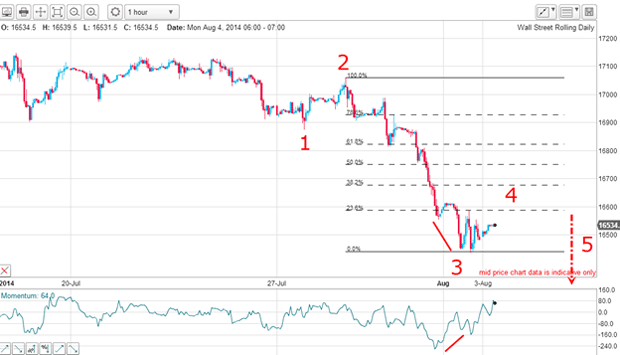
Last week's heavy losses is easily seen as my w3 and within it, I can see a clear five sub-wave pattern with a large positive-momentum divergence at the low. This heralded the temporary end of the decline. My w2 is a classic A-B-C affair, and w1 sports a lovely motive five-wave pattern. This is all very textbook.
And this morning, we are in w4 up. So, where will it end?
The rally has not even made it to the first Fibonacci 23% level yet and remains weak, so far. And with momentum at overbought levels, the rally may not have much further to run before w5 gets under way, taking the market below my w3 low.
That is my best guess scenario.
Get the latest financial news, insights and expert analysis from our award-winning MoneyWeek team, to help you understand what really matters when it comes to your finances.
John is is a British-born lapsed PhD physicist, who previously worked for Nasa on the Mars exploration team. He is a former commodity trading advisor with the US Commodities Futures Trading Commission, and worked in a boutique futures house in California in the 1980s.
He was a partner in one of the first futures newsletter advisory services, based in Washington DC, specialising in pork bellies and currencies. John is primarily a chart-reading trader, having cut his trading teeth in the days before PCs.
As well as his work in the financial world, he has launched, run and sold several 'real' businesses producing 'real' products.
-
 MoneyWeek Talks: The funds to choose in 2026
Podcast Fidelity's Tom Stevenson reveals his top three funds for 2026 for your ISA or self-invested personal pension
-
 Three companies with deep economic moats to buy now
Opinion An economic moat can underpin a company's future returns. Here, Imran Sattar, portfolio manager at Edinburgh Investment Trust, selects three stocks to buy now